Red & White Yeast Continued:
Figure 3: Experiment 2: Streaks from Red and White regions.
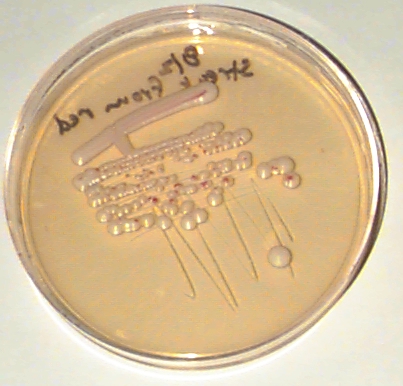
A dense sample of cells from the red region of the plate in figure 1 was streaked in a line at the top of the plate below leaving a dense line of cells. A sample of cells from the lightest end of this line was then streaked in a zig-zag. Finally, a sample from the lightest end of the zig-zag was streaked across the plate. This has the effect of spreading the cells out very thinly at the very end of the final streak. This plate was incubated for 5 days at 30C.
Figure 3a: Streak from red region:
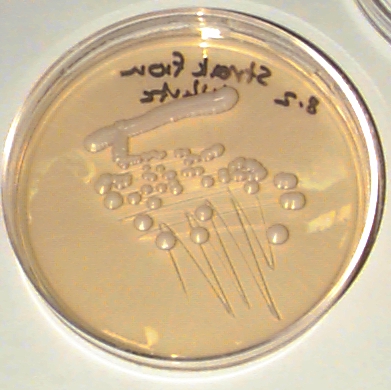
A similar streak was prepared from the white region of the plate in figure 1. The result is shown below:
Figure 3b: Streak from white region:
(2) Based on all the preceeding data, what can you conclude about why the center of the patch in figure 1 is red and the border is white?
Which of your hypotheses from (1) can you rule out?
Which are consistent with the data?
(3) What other experiments would you like to try?
Send answers, questions, suggestions to Brian White btwhite@mit.edu .
Copyright 1996 Massachusetts Institute of Technology
Brian T. White