Introduction
The origin of the city of Boston can be dated back to the year of 1630, after the original Puritan settlers in New England faced hardships in Salem and sought a new location for their town. Boston was conveniently located on the shore of Bendell’s Cove, which can be seen in an early map (from 1635) compiled by George Lamb (Figure 1). Boston also had easy access to a freshwater spring that was located on what is now called Spring Lane. Thus, some of the first colonists of the New World built their homes, businesses and institutions in the Downtown Boston site whose history this paper will analyze. During the 378 years since, Boston as a city and this individual district have undergone technological, cultural and land use changes. As Professor Warner contends, “the history of the city is to think in terms of six long waves of alternating growth and depression” [1]. These can be traced over the centuries by observing their evolution on detailed, original maps. My research draws upon maps from the 17th, 18th, 19th, 20th and 21st centuries in order to present the narrative of this neighborhood rich in history.
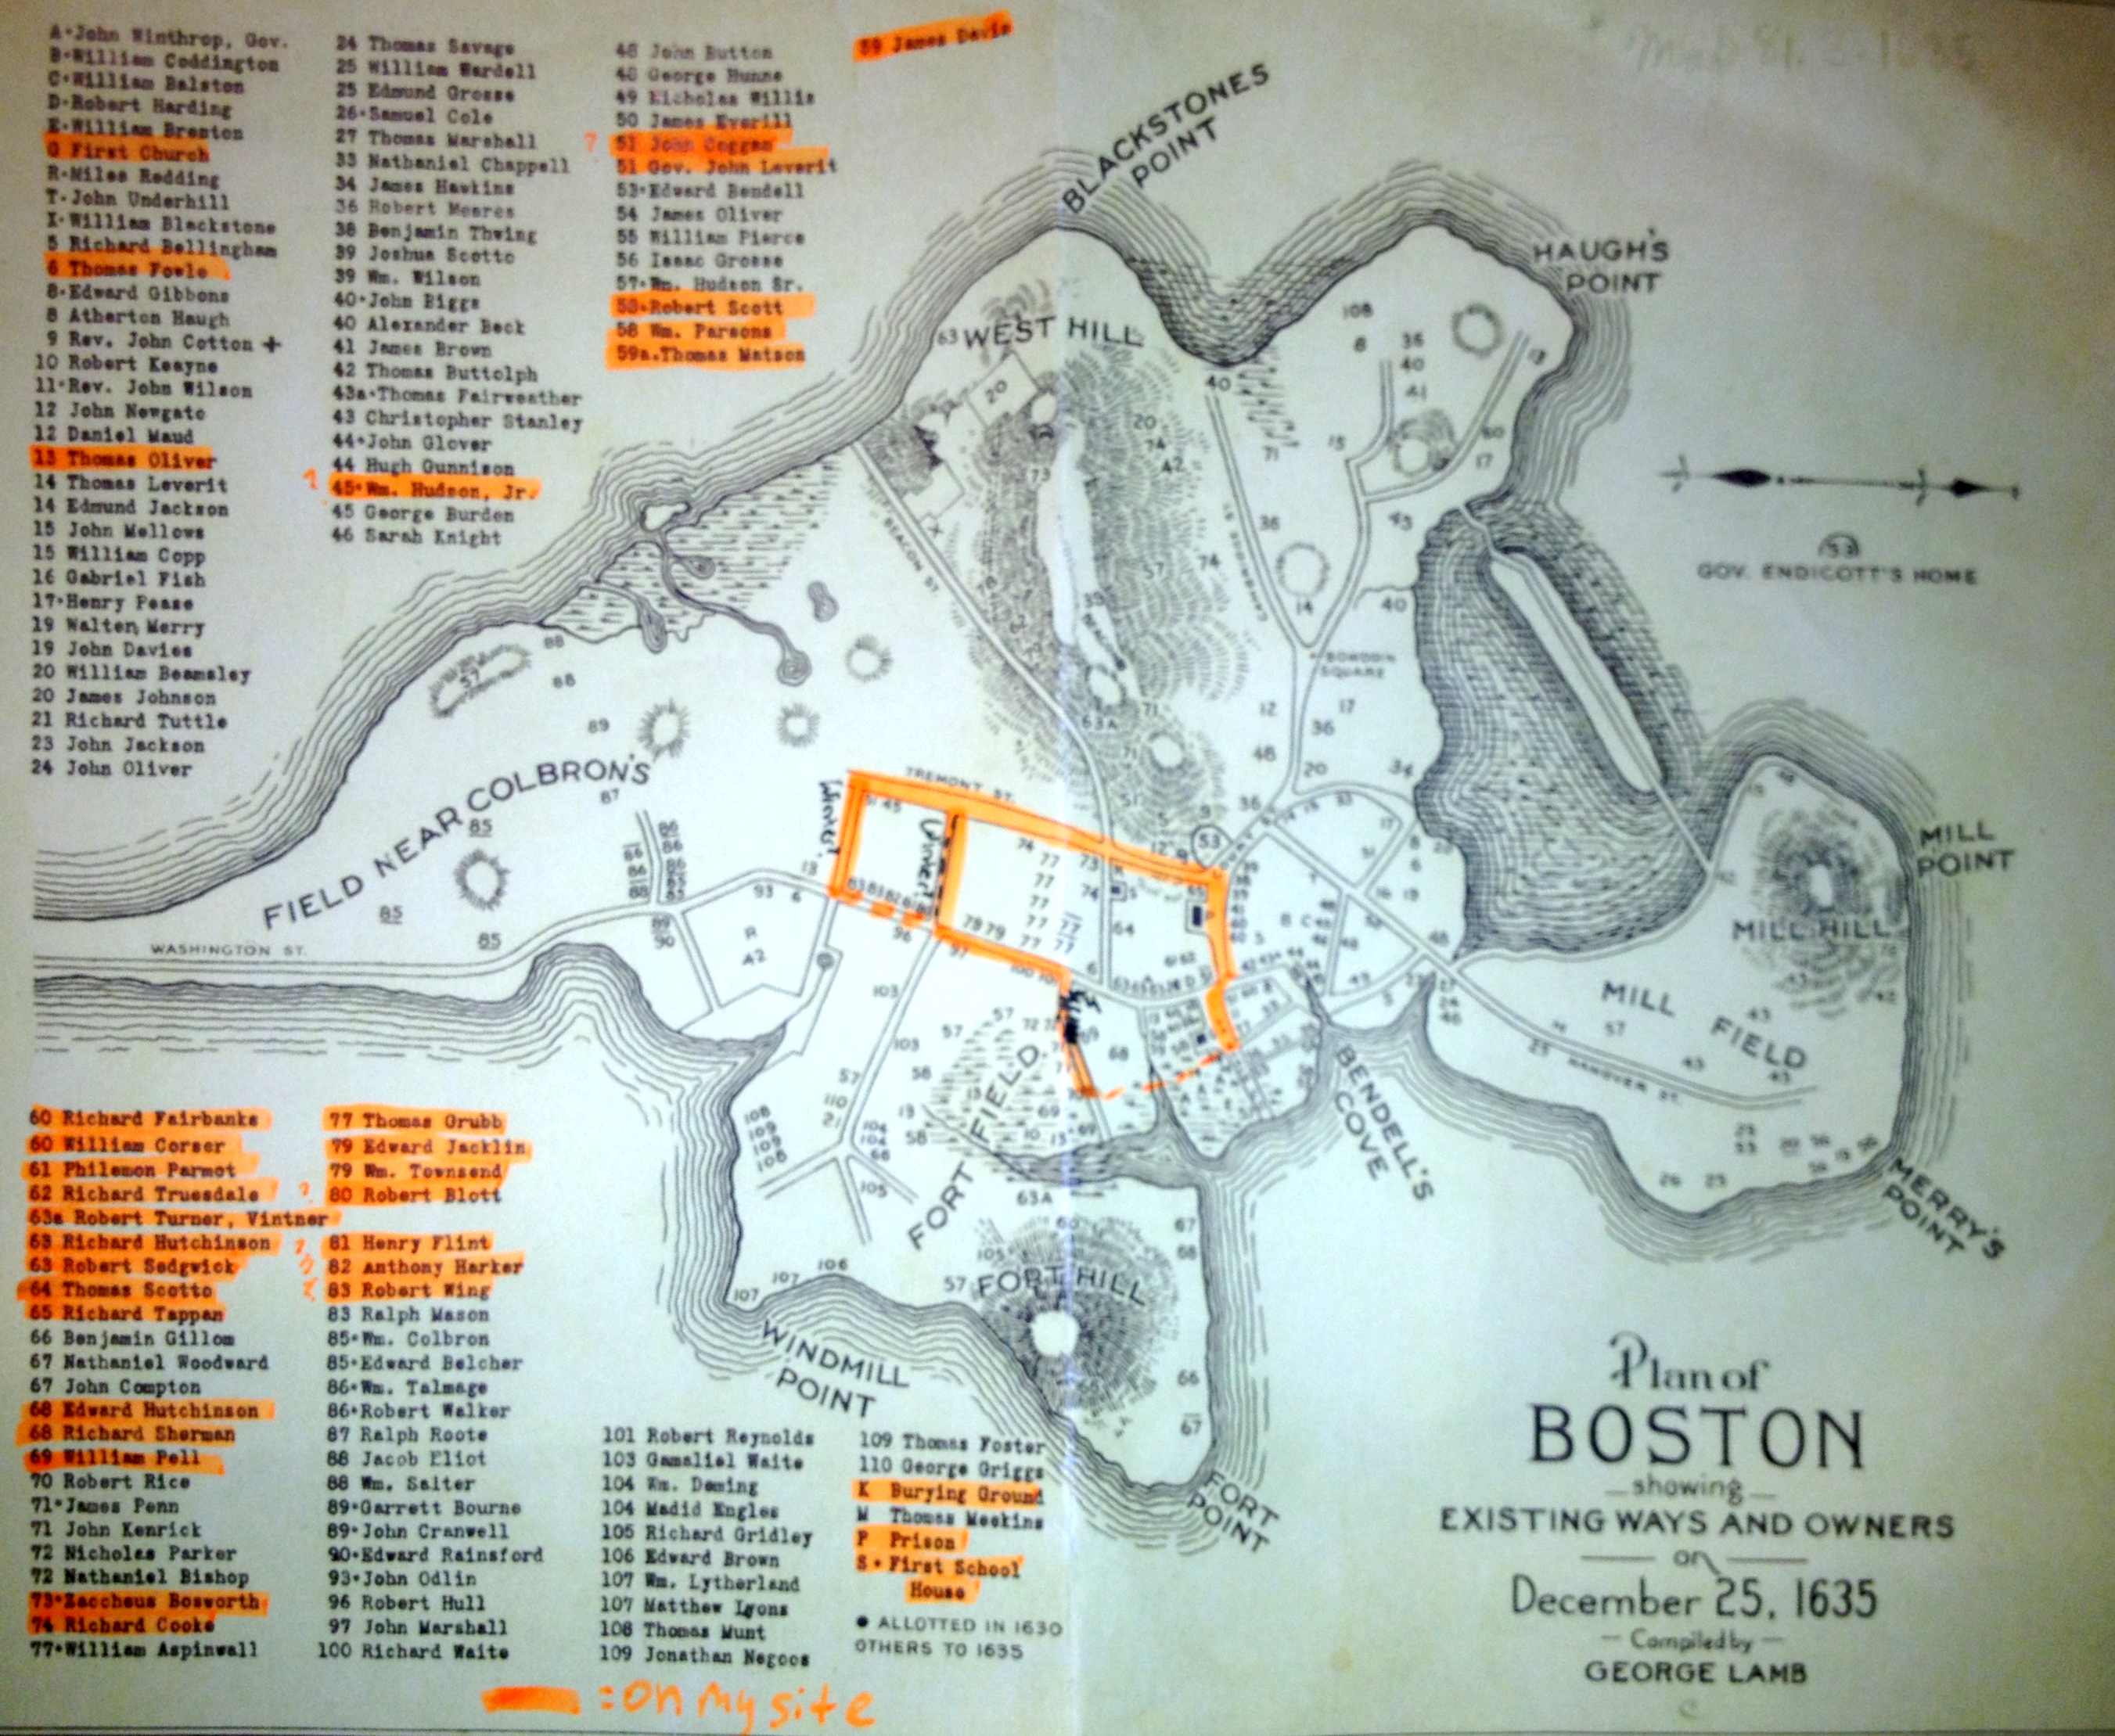 Figure 1: Plan of Boston Showing Existing Ways and Owners on Dec. 25, 1635. Lamb, George. Accessed through the Norman B. Levanthal Map Center at the Boston Public Library online http://maps.bpl.org/id/10923.
17th century
The original map of the settlement (Figure 1) shows a remarkably grid-like layout of Boston that would be completely unrecognizable, if a modern compiler had not added some familiar street names to provide context. Tremont Street, which was named for its proximity to the original three hills of Boston (of which two have since been flattened,) has been located in the same orientation for nearly four hundred years. However, I cannot be certain that Tremont (or any of the other street names on this figure) was the name that the Puritans called it, since other names that are labeled on this map (such as Washington Street) only became historically significant in the 18th century. Regardless of their names, the few streets that existed in 1635 were in the nearly the exact same orientation as today’s paved roads. Several streets have been lengthened and new ones have since been added, but overall the layout of the central city has remained consistent over time.
Surnames of property owners, such as Oliver, Davis, Hutchinson, Fairbanks, Townsend, Cooke, Sherman and Flint, are evidence of the ethnic homogeneity of the original settlement. As a Puritan, English colony, the land-owning population was white and Christian. There was a single church for the entire community (then called “First Church”) that was located on what is now called State Street. Lots were generally large and spaced out. The map offers no indication of whether a particular lot was used for residential or commercial purposes, but my hypothesis is that the original settlers focused on building homes before building businesses, so most of the lots were probably residential or a combination of residential and commercial. Some families did own multiple separate plots, possibly for their businesses or extended family; most notably, Thomas Grubb owned seven. Enormous plots such as the Field near Colbron’s border my site to the West, and Fort Field is to the South. Just as or shortly after Lamb drew his map, Reverend Blaxton’s Farm (the Field Near Colbron’s) became the Boston Common [2]. My site also contains the original school house of Boston, which was the New World’s first public school: First School, which became known as The Boston Latin School, and which still exists but has since moved from Downtown. This explains why there is currently a School Street in Downtown, but no site to be found any more. A burying ground neighbored the school, and a prison was one street over (on modern-day Court Street).
18th century
In 1711, Bostonians “piled up the rocks and wooden piles to make their Long Wharf in the middle of [their] little harbor… [and thus,] the center of the city became fixed in the form that we now know,” anchored by the Old State House (built in 1713), which was the town market and stood on high ground overlooking the wharf, on what would later be named State Street and become the “business spine of the city” [3]. According to Professor Warner, a “colonial wave of prosperity lasted from 1630 to about 1740. It was followed by half a century of war, revolution, and hard times” [4]. By 1775, Boston was in a tense political situation and transitioning from its colonial status to its position as the center of American liberty. Figure 2 shows a Boston on the edge of war, as it existed just before two-thirds of its residents fled from the Revolution and an additional three thousand Boston Tories sailed with the British fleet that abandoned Boston in March of 1776 [5]. Relics of British colonialism still appear on this map, including King and Queen Streets, which have since been renamed to Court and State Streets. This probably was easily done by a government that both had control of the public streets and had recently separated itself from England. The First Church from 1635 appears to have been replaced by the Town Hall and King’s Chapel was constructed further Southwest, where The Boston Latin School had been located in the 17th century. Strangely, conflict with the King was enough for the people of Boston to rename their streets but not their church, as the King’s Chapel retains its name even today. It is possible that this is because, even as Americans declared their independence from Britain, they still associated their religion – the official British faith, at the time – with the monarchy. The Burying Ground from 1635 is no longer labeled on my site, but it is possible that it became part of the King’s Chapel property, since I have observed a graveyard on my site visits there.
Luckily for Boston’s commerce, there were plenty of “merchants from the small ports, like Salem and Marblehead,” who were willing and able to transfer “their businesses to Boston to fill the vacuum left by the fleeing Tories. They formed the core of a new merchant aristocracy” that was able to prosper by meeting the demands of the trading opportunities of the various European wars of the late 18th and early 19th centuries; This mercantile success continued until after the Civil War [6].
The road network in Figure 2 shows that 18th century Downtown was already starting to resemble its irregularly-shaped, present-day form. As Boston became denser, the neighborhood needed to support a large, pre-Transportation Revolution (pedestrian and equestrian) population. In order for many people to be able to live in work in such a small geographical area, smaller lot sizes became common and there was a greater need for street construction. The new streets often obliquely cut across the layout of the original four large blocks shown in Figure 1, likely to make routes for commuters and errand-runners even more efficient. The new streets would have decreased the bustling traffic of people and horses on the pre-existing streets, and could have even made the task of cleaning up the wastes of urban residents/horses easier. Among the new street additions shown on Figure 2 were Pudding Lane, Governor’s Alley and Cook’s Lane. Overall, despite the shortage of land use information in Figure 2, it seems as though Downtown was a mix of residences, businesses and institutions. Certainly, it was a center of state, including the Town Hall, Old Meeting House, Prison (which is in its same location as in Figure 1), Province House, and South Meeting Houses.
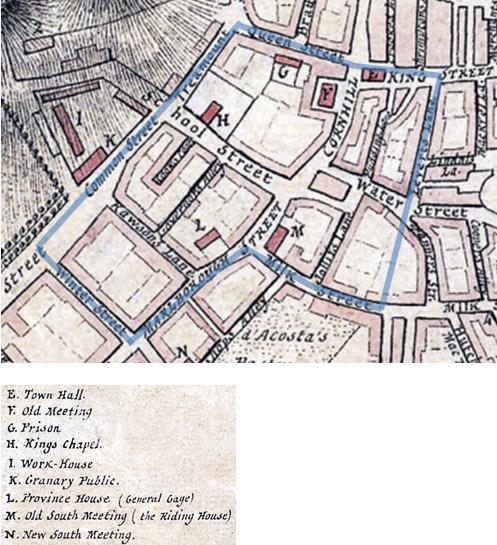 Figure 2: “A Plan of the Town of Boston (1775).” Accessed online through http://www.bostonbyfoot.org/docs/maps/boston-1775.jpg
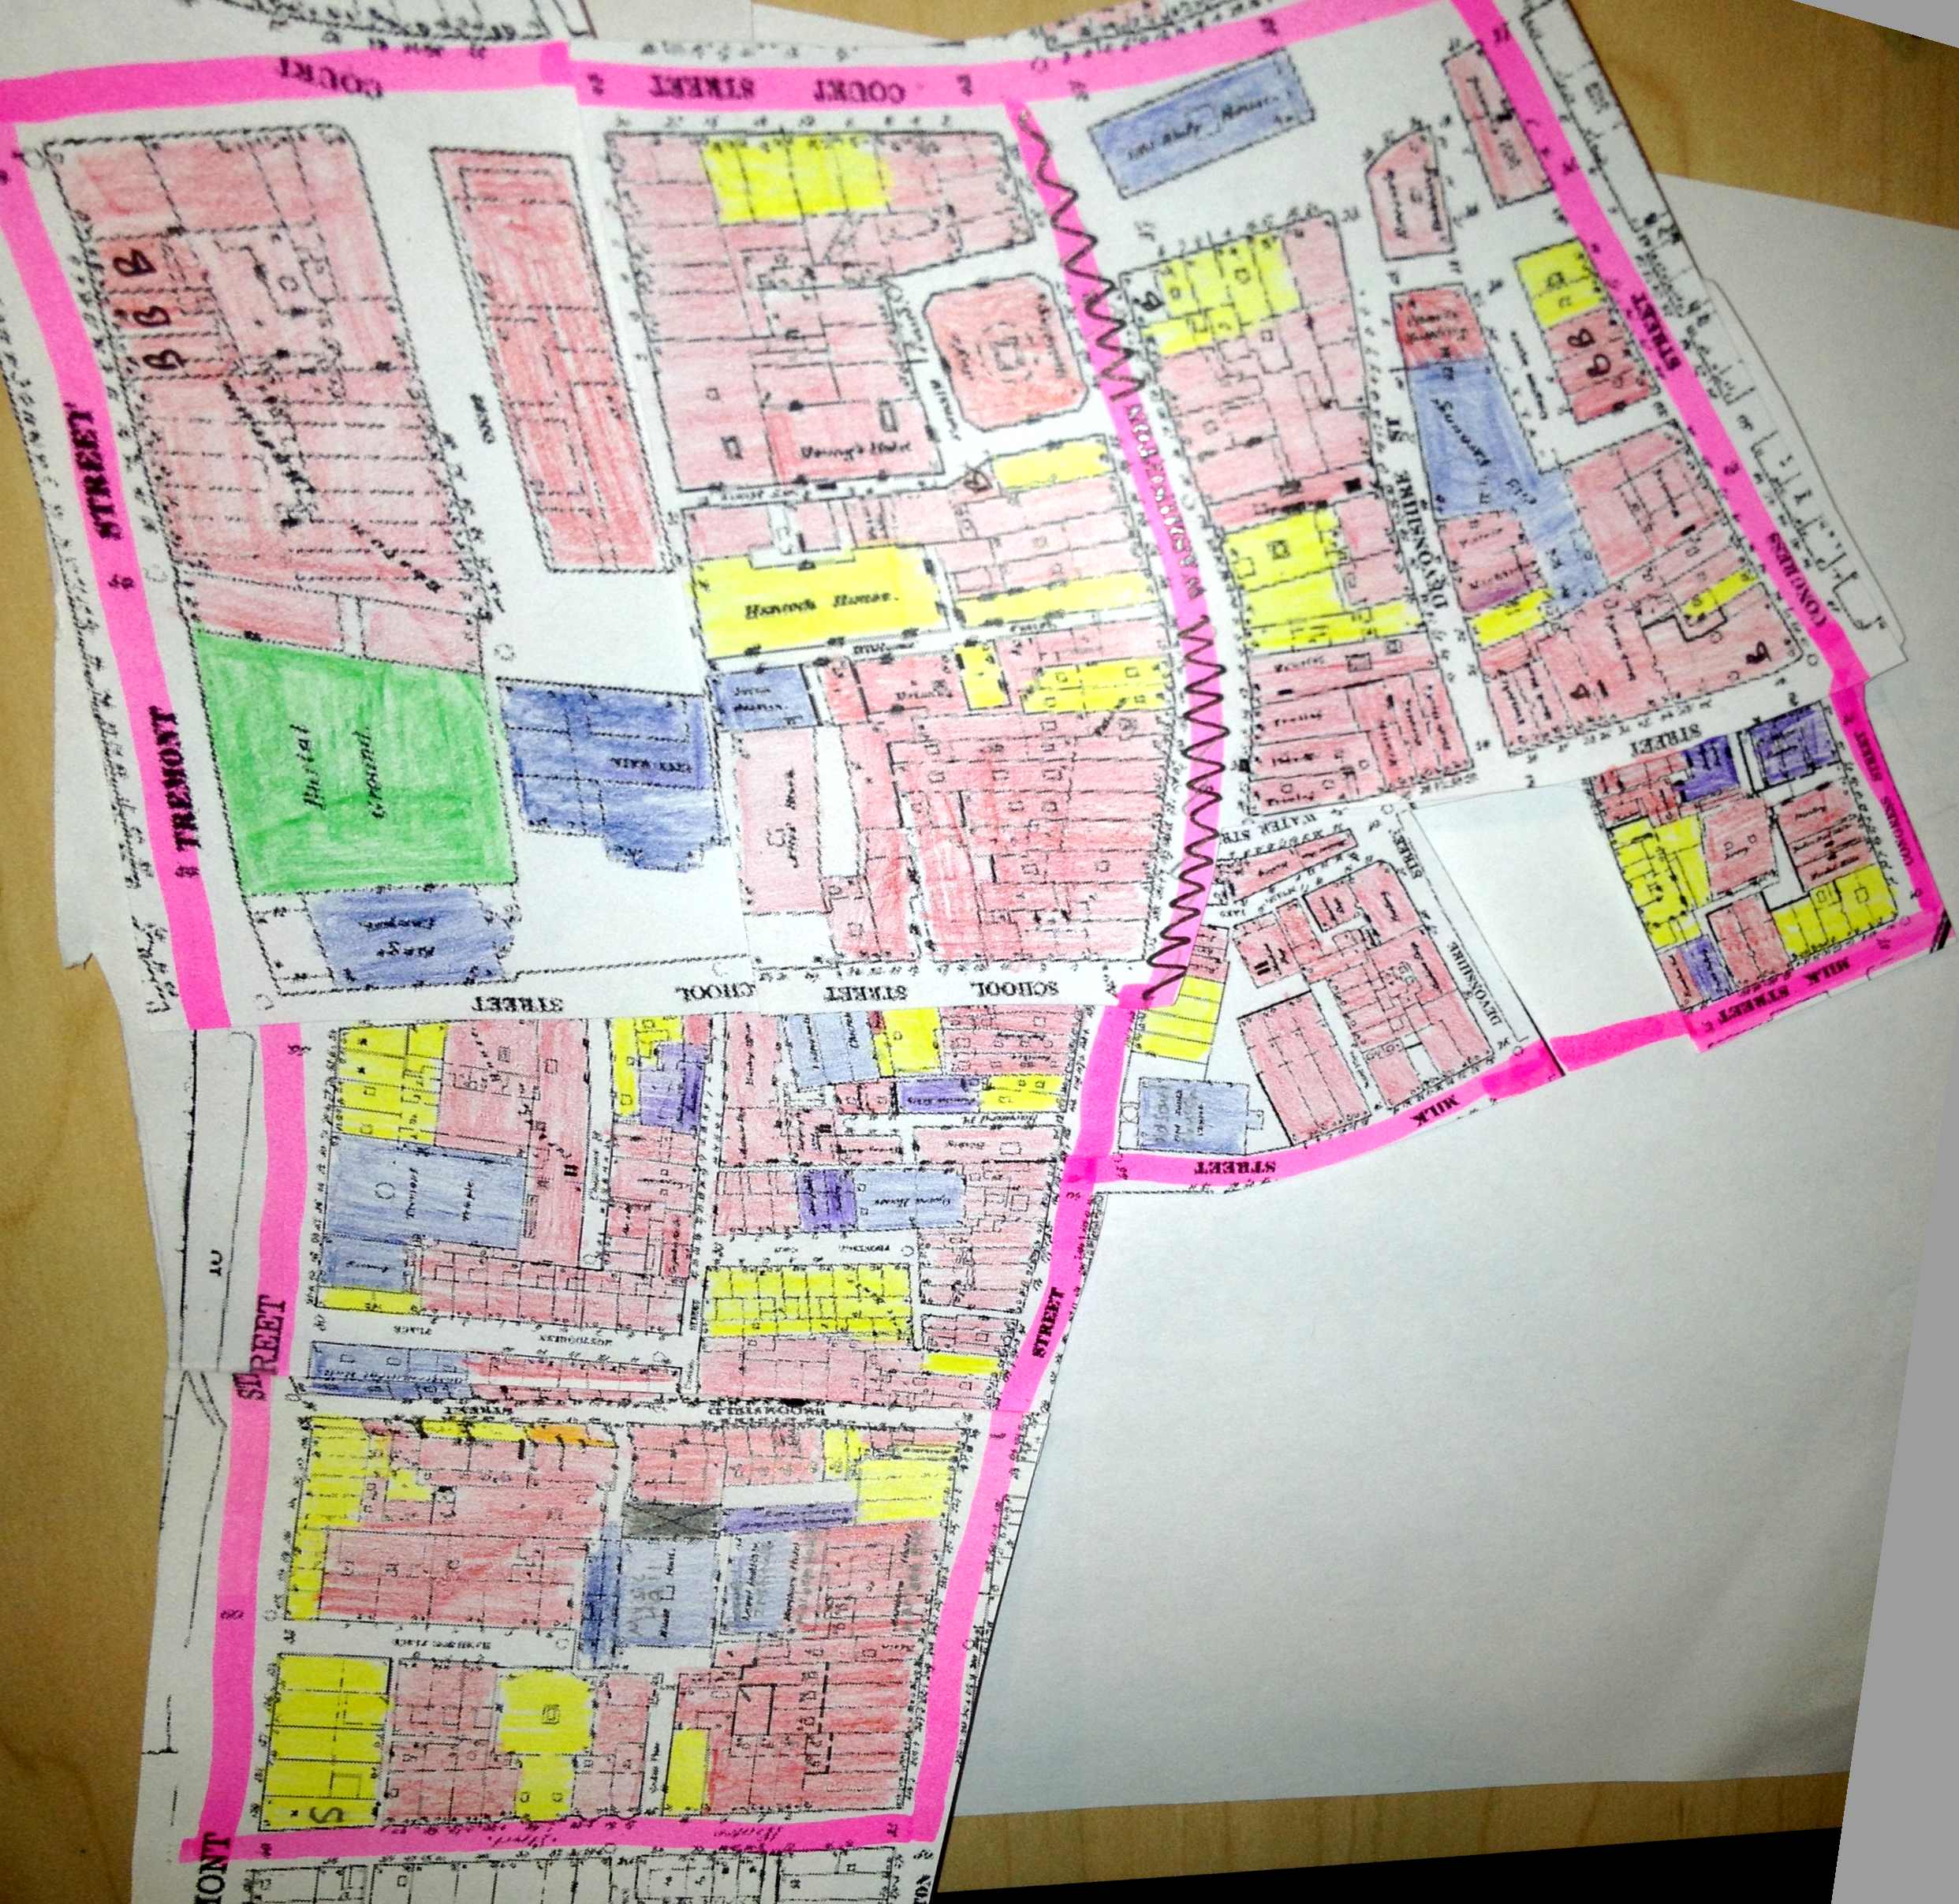 Figure 3: Sanborn Fire Insurance Map of Boston, MA (1867). Sheets 16_a, 16_b, 11_a and 12_a
Key: Red=Commercial, Yellow=Single-family dwelling, Blue=Institutional, Green=Parks/Open Space, Purple=Industrial, Orange=Flats
19th century
Beginning in the 1790s and extending, “despite sharp panics and depressions,” until 1921 was a “long period of growth and prosperity,” brought about by a “merchant-shopowner-craftsman coalition,” that facilitated new public projects to modernize Boston, including: “everything from libraries, schools, and hospitals to water, sewers, and parks” [7]. From the mid to late 19th century, a combination of new industrial technology/methods and a pool of cheap (Irish, Italian and Eastern European Jewish immigrant labor) allowed the city to thrive in manufacturing of clothing, metal alloys, musical instruments, locomotives and machinery; thus “the mercantile city commenced its transformation into… the region’s largest industrial manufacturing center” [8]. Figure 3 shows several of the industrial buildings that resulted from this manufacturing boom. Manufacturers likely benefited even more, though indirectly, from the prosperity of the merchants that sold the manufactured goods through their commercial operations.
The earliest available Fire Insurance Atlas for Boston is presented in Figure 3, with land use colored in. This site was clearly dominated by commercial buildings in 1867, but also included a variety of other uses. Although most of the buildings are neighbored by others of the same land use (i.e. there are multiple dwellings or stores in a row), the groupings are fairly small, especially on the Western side of my site. Industrial and institutional buildings are mostly isolated, dwellings normally occur in groups of two to six, and the high volume of commercial buildings results in the largest clumps of six to twenty stores together. Overall, this gave the district an appearance of heterogeneity; there was no single block that was solely residential/commercial/industrial/institutional. This can probably be attributed to the lack of transportation technology at the time. People living in Downtown Boston would have walked to any store that they visited or worked at, so their dwellings were probably near most of the goods and services that they needed and their places of employment. Jackson confirms my hypothesis in his outline of the characteristics of the walking city. Not only were walking cities congested/dense with small lots, but the functions of different lots were mixed: “there were no neighborhoods exclusively given over to commercial, office or residential functions. Factories were almost non-existent, and production took place in the small shops of artisans. There were no special government or entertainment districts. Public buildings, hotels, churches, warehouses, shops and homes were interspersed, or often located in the same structure,” which also meant that the walking city’s inhabitants lived close to work [9]. My other observations of this map are that: With the exception of the large institutional properties and the Hancock House (in the North-central part of Figure 3), the lots were quite small and densely-packed. This can be considered an indicator of the population growth from 1200 Puritans in the 1640s to 170,000 urbanites by 1850 (almost 150-fold growth). Also, only a few buildings were stone or wood; the rest were mainly brick, which was probably because clay was the most easily-accessible building material along the Atlantic shore.
In the late 19th century, Downtown Boston faced a local, post-Civil-War trend that persisted for decades afterwards and that the rest of the United States encountered by the 1940s (post-World War II). After the North’s victory in the Civil War, the “privileged urban group [the upper middle class] had essentially three residential options in the latter three decades of the nineteenth century – to remain in a private dwelling within the city, to move to an elegant apartment house, or to relocate on the growing edges” [10]. In Figure 4, the residences of those who chose the first option are marked as estates; they are generally larger and more clustered together than the residences in Figure 3 were. According to Professor Warner, the option of staying in city dwellings “was especially difficult because of rapid physical and demographic changes in large cities. The older residential areas were often close to the central business district, and property values were rising rapidly in anticipation of a change in land use. Speculators bought such properties in the hope that the houses could be torn down to make room for commercial development,” [10]. Meanwhile, Otis’s “safety elevator,” which had been invented in 1852 (as we learned in class), gained popularity as developers’ demand for vertical office space increased. The earliest skyscrapers began to rise and department stores were invented, unlocking the potential for dramatic change in the commercial landscape of Downtown forever. Living at the edge of the city became realistic when transportation technology was revolutionized by the invention of streetcars and trolleys. In Figure 5, Boston’s Green Line of public transportation began in Downtown, with just three stops (including Park Street, at the Southwest corner of my site), in 1897.
Figure 4 shows an approximately even mix of residential, commercial and institutional land use. Notably, there are barely any more vacant spaces on the map: almost every inch of land appears to be developed. By 1898, industrial companies had moved to (the likely cheaper, larger) properties outside of Downtown. A large US Post Office and Sub Treasury building opened in the Southwest corner of my site, replacing a block of many small residences and businesses from Figure 3 and asserting the still-strong presence of government in Downtown. During this time, government also took on the role of historical preservation. The Old South Meeting House also became a museum and, in the process, bought several smaller properties to take over the corner of Washington and Milk Street. The Parker House and Young’s Hotel appear in this map, marking the shift of the neighborhood towards tourism, and “the center of the business district, at the focal point of community activities… [at] the very heart and soul of the city,” [11]. Yet another piece of evidence that this district is at the center of the city’s activities is the block of newspaper companies along Washington Street, including the Boston Post, Herald, Globe and Advertiser. By their nature, journalists seek action to report on, so it only makes sense that they would pick the most energetic part of the city as their hub.
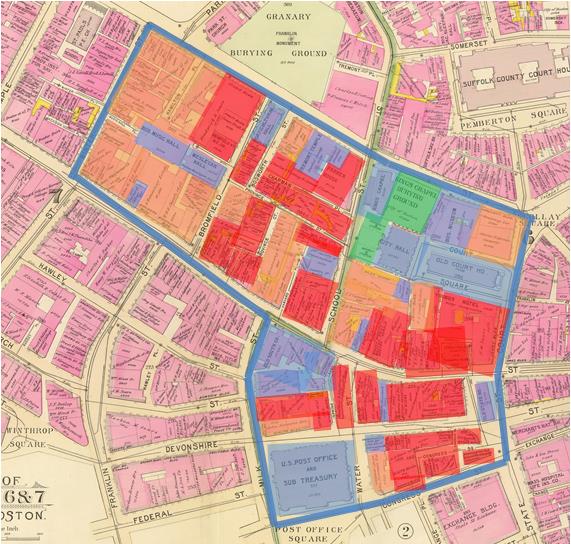 Figure 4: Bromley Map of Boston, MA. From the David Rumsey Map Collection. Part of wards 6&7, city of Boston. (1895).
http://www.davidrumsey.com/luna/servlet/detail/RUMSEY~8~1~29218~1130277:Part-of-wards-6-&-7,-city-of-Boston?sort=Pub_List_No_InitialSort%2CPub_Date%2CPub_List_No%2CSeries_No&qvq=w4s:/where/Boston%20(Mass.);q:bromley%2Bboston;sort:Pub_List_No_InitialSort%2CPub_Date%2CPub_List_No%2CSeries_No;lc:RUMSEY~8~1&mi=5&trs=50#
Figure 4: Bromley Map of Boston, MA. From the David Rumsey Map Collection. Part of wards 6&7, city of Boston. (1895).
http://www.davidrumsey.com/luna/servlet/detail/RUMSEY~8~1~29218~1130277:Part-of-wards-6-&-7,-city-of-Boston?sort=Pub_List_No_InitialSort%2CPub_Date%2CPub_List_No%2CSeries_No&qvq=w4s:/where/Boston%20(Mass.);q:bromley%2Bboston;sort:Pub_List_No_InitialSort%2CPub_Date%2CPub_List_No%2CSeries_No;lc:RUMSEY~8~1&mi=5&trs=50#
Key: Red=Commercial, Orange=Single-family dwelling, Blue=Institutional, Green=Parks/Open Space, Purple=Industrial
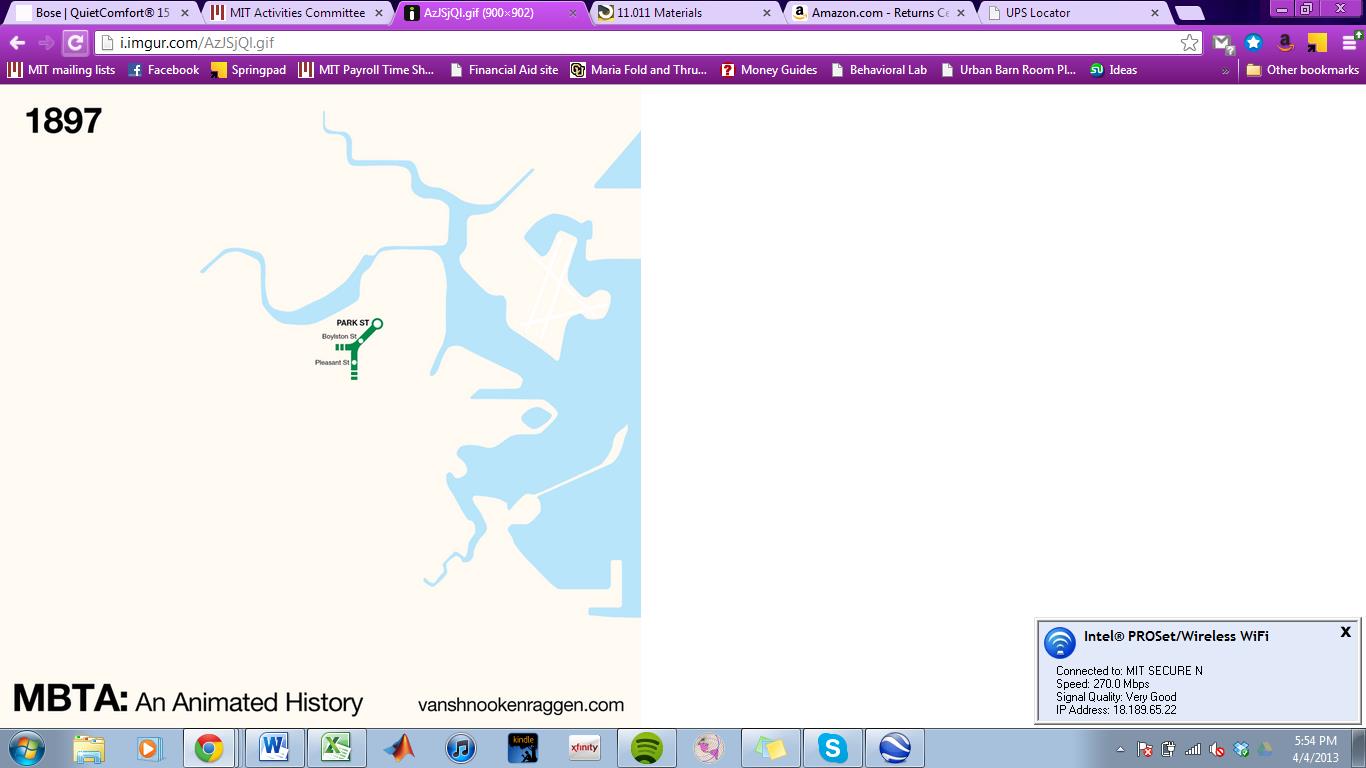 Figure 5: “MBTA: An Animated History.” (1897). Accessed through http://i.imgur.com/AzJSjQl.gif.
20th century
Figure 8 shows that, by 1929, almost all residences had been converted into commercial space, as the trend of moving away from the city that began in the aftermath of the Civil War continued into the 20th century. This was promoted by the affordability of suburban homes and the progression of transportation technology that allowed workers to commute into Downtown by car or by rail. Figures 6 and 7 show the expansion of “the T,” as it radiated out from my site to further and further distances. By 1941, there were four stops on or adjacent to my site: Park Street, Washington/Summer/Winter, Milk-State/Devonshire, and Scollay Square. All of the T lines led to Downtown, so it was possible to live at any end of a line and take the T into work each day. Technological advances also allowed architects to build upwards, so the lots became very large in order to accommodate the skyscrapers that housed banks and offices. However, this growth was tempered by the sober reality of the time: “The long New England and Boston depression that came in 1921 with the collapse of wartime prices and demand… was a time when the old Boston families left the city for the suburbs and when the new immigrants made a settled place for them-selves in the city... Most made seasonal adventures to the big downtown department stores... In 1920 Boston's population was 750,000; by 1960 it had fallen to 697,000... These decades of depression were also decades of national corporate growth, of the gathering in of local firms and capital into large corporate organizations. Some Bostonians took an active role in this new phase of American business,” [12] The late 1920s and ‘30s were also impacted by the large-scale economic issues of the United States’ Great Depression. A vacant hotel is labeled in the Sears Building next to Court Square. More vacant property is to the South, next to City Hall. These subtleties hint at the larger-scale issues of the nation.
Although World War II brought tragedies to many families, wartime demands for goods brought relief to Boston suppliers [13]. Then, around 1960, “a new regional economy of electronics and a city shift to finance and services restored prosperity and brought on a further remaking of the city,” which is reflected in the observations that I already made about land use and property size [13]. “Boston's financiers invented new institutions of venture capital and mutual funds that revived the beleaguered financial district. But local innovation went forward within a context of national power so that old firms... were absorbed by nationals," adding an additional layer of complexity that did not originally occur to me when I studied Figure 8 and saw recognizable national brand names of the past and present [14].
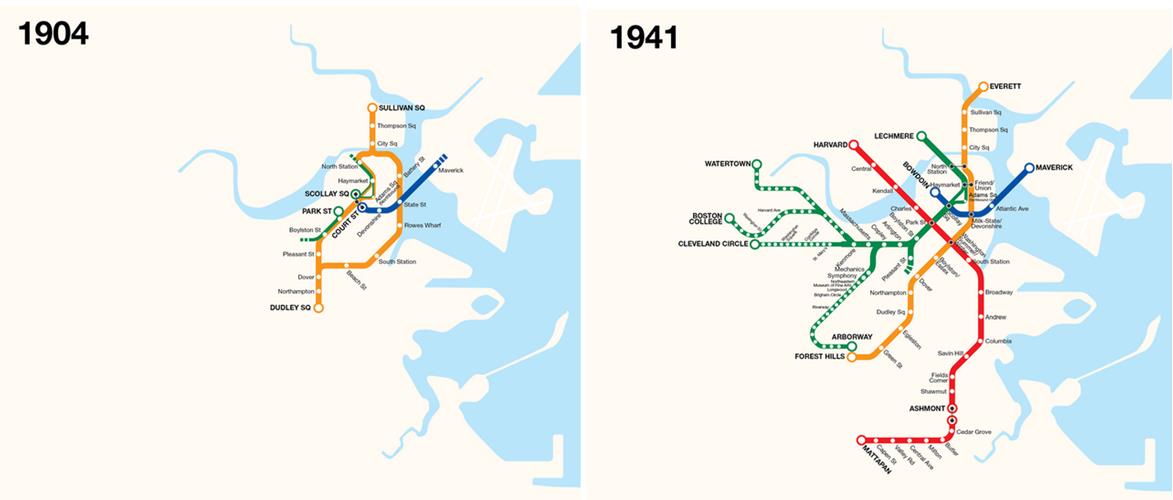 Figures 6 and 7: “MBTA: An Animated History.” (1904 and 1941). Accessed through http://i.imgur.com/AzJSjQl.gif.
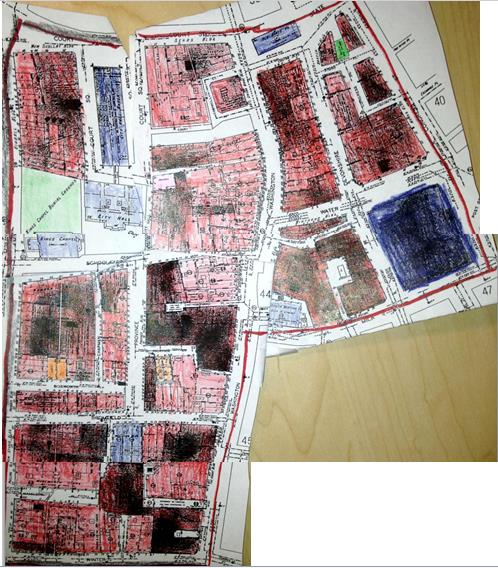 Figure 8: Boston, Massachusetts Sanborn Maps. Accessed online through: http://sanborn.umi.com.libproxy.mit.edu. Volume 1, 1929 (North), sheets 36, 43 and 44.
(Regrettably, the original quality of the Sanborn image was poor. I did my best to make the land use colors evident despite the black patches).
Key: Red=Commercial, Orange=Flats, Blue=Institutional, Green=Parks/Open Space
21st century and beyond: Conclusion
Today, the highly-commercial land use shown in Figure 9 makes present-day Downtown Boston appear deceptively similar to 1929 Downtown. But of course, the 2-Dimensional map does not capture the facts that skyscrapers have continued to grow higher, their steel skeletons and glass facades have become stronger and more modern, and the businesses held within their walls are undoubtedly very different from those that occupied the previous buildings more than 70 years ago. Since 1929, entirely new industries have been invented. These industries can employ more people in a single building, because elevators have allowed employers to use vertical urban space. The lifestyle of those who work in Downtown has also evolved: people can live further and further from the city now that cars are faster and more efficient, and parking garages can be built underground in order to avoid wasting valuable ground-level space. The T has expanded more still, as shown in Figure 10, allowing those who cannot afford a car to take public transportation to their homes on the outskirts of the city. Yet, simultaneously, modern Downtown still has a very pedestrian-friendly atmosphere, with benches and pathways that facilitate a walking lifestyle that may not have been as popular in the mid-20th century (when cars had recently become fashionable, or even commonplace). Consumer culture has also undergone a tremendous shift during the 20th century. Downtown used to be a destination for shoppers who sought to buy everything they needed in one annual trip to a single store. The rise of suburban shopping malls eliminated the need for huge, Downtown department stores, such as Woolworth’s (which has now been replaced by the Suffolk University Law School). Today, numerous smaller specialty stores and restaurants are far more popular. The commercial buildings denoted on Figure 9 typically house these small stores at the ground level and office space for above (whether there are only a few levels of offices in a low-rise building, or dozens of levels in the modern skyscrapers). Only one building is shaded as “Mixed Use (Residential/Commercial),” marking the end of the progressive shift, from 1635’s dominantly residential land use, through the mixed-use walking city of the 18th and 19th centuries, until the modern age of commercial land use and mixed transportation. Changes in transportation/building technology, local housing prices, and regional or nationwide economic climate have all caused changes to maps of Downtown Boston over the centuries. Certainly, as we look to the inevitable dynamics of the future, we can expect that the land use map of the year 2100 will look very different from Figure 9. It is possible that Downtown Boston may even transition back to mixed land use, as office buildings begin to include luxury condominiums for young, urban professionals. It is not only convenient, but also fashionable to live and work in the Downtown/Financial District of many major American cities (such as New York, Chicago, Los Angeles and Dallas), and I hypothesize that Boston is heading in that direction, as well.
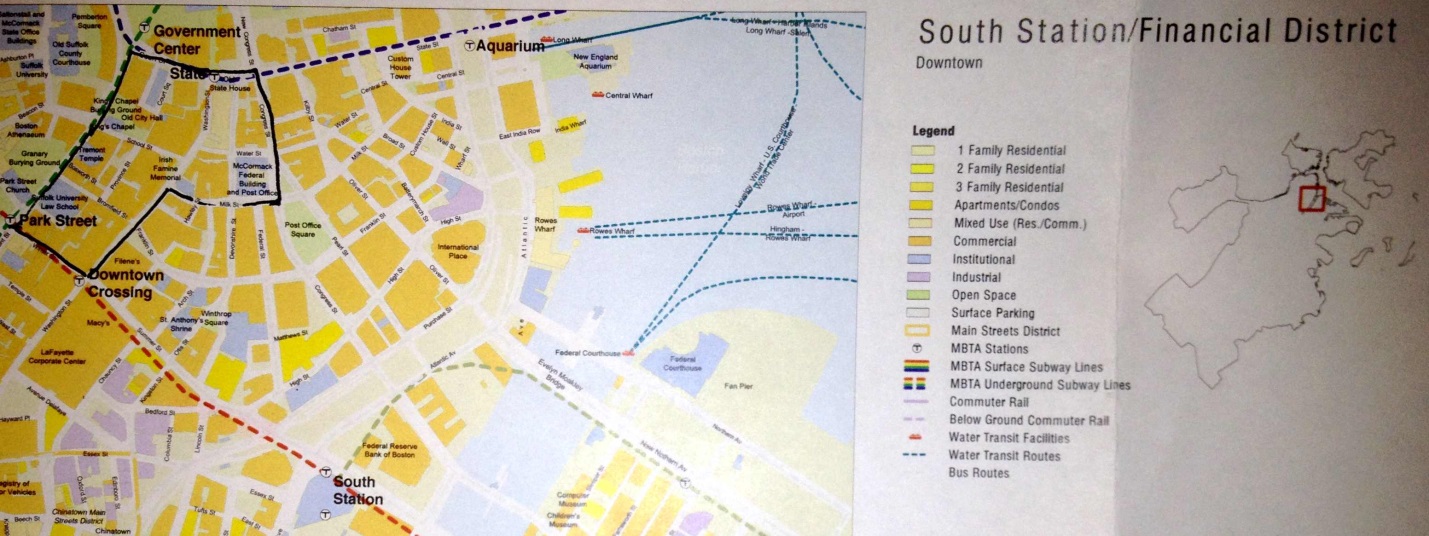 Figure 9: Boston Redevelopment Authority Land Use Map. “South Station/Financial District, Downtown.” (2000).
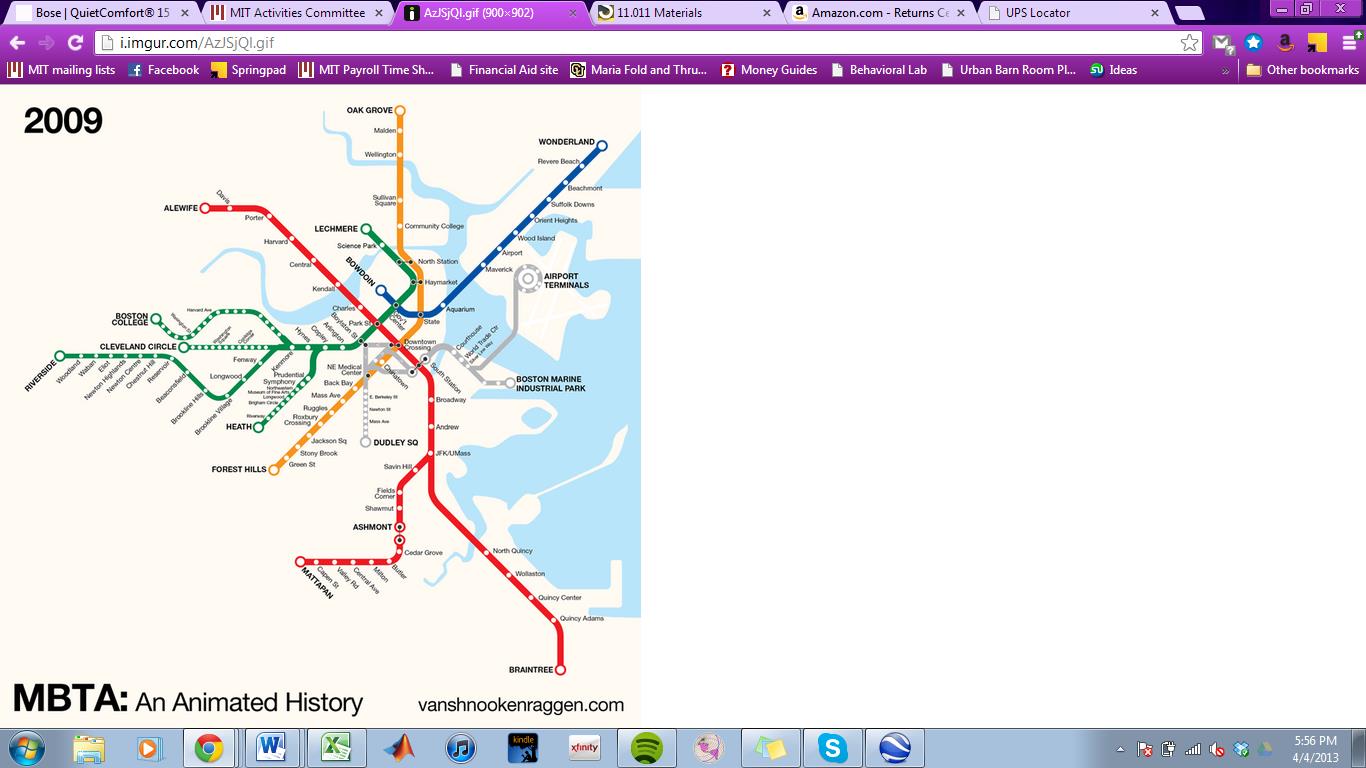 Figure 10: “MBTA: An Animated History.” (2009). Accessed through http://i.imgur.com/AzJSjQl.gif.
[1] Warner, Sam Bass. Mapping Boston. The MIT Press, Cambridge, MA. 1999, 5.
[2] Ibid., 3.
[3] Ibid., 3 and 5.
[4] Ibid., 5.
[5] Ibid., 6.
[6] Ibid., 5 and 6.
[7] Ibid., 6.
[8] Ibid., 7 and 8.
[9] Jackson, Kenneth. Crabgrass Frontier: The Suburbanization of the United States. Oxford University Press, NY, New York. 1985. Kindle edition (no page numbers, instead “location” numbers) location 324 through 358 of 9107, 20% progress through the book.
[10] Ibid., location 1799.
[11] Ibid., location 5015.
[12] Warner, Sam Bass. Mapping Boston. The MIT Press, Cambridge, MA. 1999, (10).
[13] Ibid., 6.
[14] Ibid., 11-12.