In just over one century, from the mid 1800s to the mid 1900s, my cite grew into a diverse residential neighborhood, was demolished, was rebuilt with increased commercial use, and was altered by transportation advances and institutional expansion. Lying on either side of Cambridge Street, my site straddles Boston’s Old West End and Beacon Hill. It experienced waves of immigration, most notably an influx of Irish during the potato famine in the 1840s followed by the arrival of Eastern European Jews in the early 20th century. These forces shaped it into a diverse, close-knit community. In the 1950s, however, it became the victim of urban renewal. In a misguided effort to revitalize areas it viewed as slums, the government evicted many West End residents and replaced the older residential blocks with mixed commercial and residential superblocks. My site saw further changes due to advances in transportation: first, the extension of the red line and construction of Charles/MGH station; next, the rise of the automobile; finally, the construction of Storrow Drive. These changes may have been motivated, in part, by the expansion of MGH, which attracts doctors, patients, and family, from near and far. My site underwent a drastic transformation in the span of 100 years due to the combination of these forces.
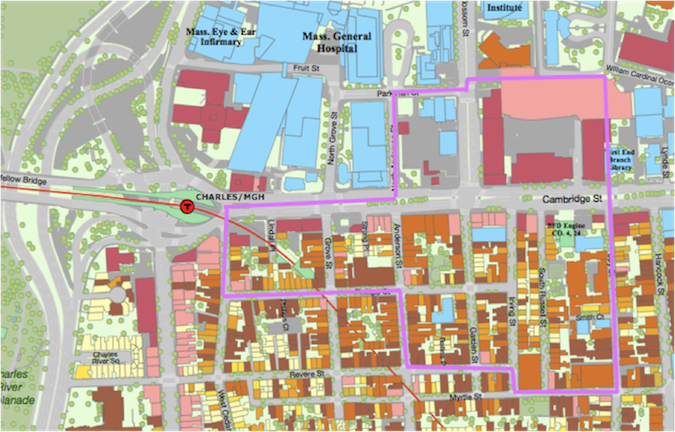 Map showing current land use and site boundaries (purple)1
 As Krieger Explains in Mapping Boston, the West End served as a railroad terminal, and as such was home to many manufacturing companies, which were drawn to the port and the tracks leading into the city. The presence of these companies created factory jobs, which attracted immigrants arriving in Boston ii. This accounts for the large immigrant population that entered and shaped the West End during the 19th and 20th centuries. One can trace the arrival of various groups of people through maps by the examining the types of institutions present during different eras and making note of the names of property owners.
Prior to the great influx of immigrants to my site, the area was home to a large African American community, many of whom first settled on the North Slope of Beacon Hilliii. One can see evidence of this population in the existence of a “Negro Church” along Smith Ct. and the M.E. Zion Church, labeled “colored”, along Russell Pl. on an 1885 map of Boston (fig 1)iv. The presence of the churches reveals the magnitude of the African American population, while the fact that they are labeled “Negro Church” and “colored” suggests that there was still some segregation in that time period, just after the Civil War. The African American population gradually moved out as speculators began building tenement housing for immigrants moving in from the West End flatsv.
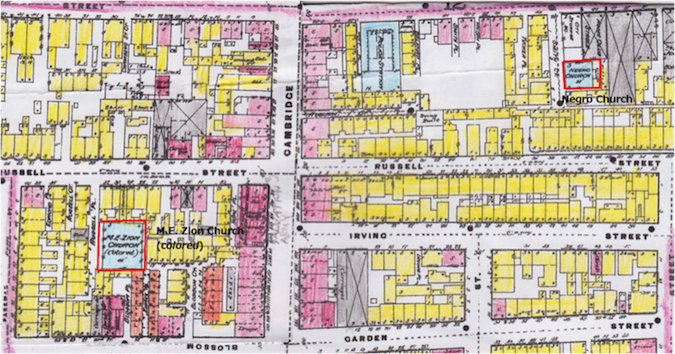 Figure 1 – 1885 – African American Churches
 The first major wave of immigration to hit my site was the arrival of the Irish beginning in 1845, as a result of the potato famine. By 1880, native-born Irish-Americans had established a strong community within the West End while retaining their Irish identityvi. One can see this transition in the appearance of Irish surnames, like Burke, Doyle, Cooley, Murphy, as property owners on an 1874 map of Bostonvii. Many Irish names, including Cannon, Kelly, and O’Connell, are also present on a 1912 map of the regionviii.
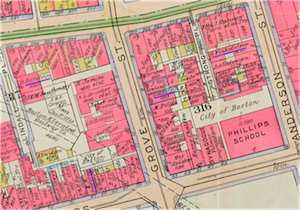 Figure 2 – 1912 – some Irish surnames underlined in green, Jewish in purple
 Similarly, one can track the immigration of Eastern European Jews in the late 19th and early 20th century centuries by the appearance of names like Finkelstein, Goldstein, Cohen, and Goldbergix. The influx of Jewish immigrants altered the religious composition of the neighborhood, and the immigrants built synagogues and Jewish Community Centers, as shown by figure 3x.
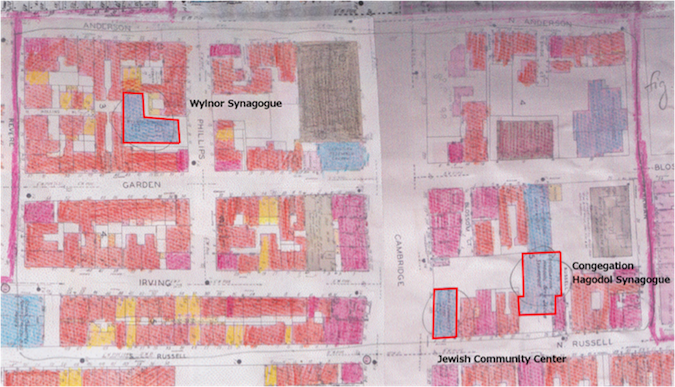 Figure 3 - Synagogues and Jewish Community Centers
 The result of these patterns of immigration resulted in a diverse, but close-knit community. The character of this old West End is very visible when looking at a map indicating land use. As shown in figure 4, the majority of the land on my site up through the early 20th century is for residential use. The other uses generally support the residential population. The area is sprinkled with shops and institutions like schools, religious buildings, community centers, health services, and police and fire departmentsxi.
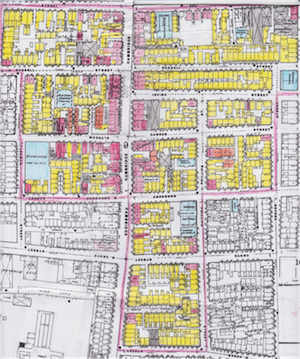 Figure 4a – 1885 – residential areas shown in yellow (no distinction was made between single and multi family dwellings), institutions such as schools, religious institutions, and public services shown in blue, stores shown in red, transportation structures shown in gray, and tenements shown in orange
 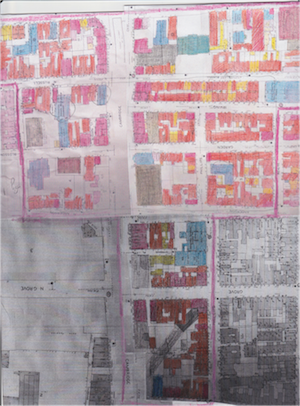 Figure 4b – 1929 – residences shown in yellow (for single family) and orange (for multi family), institutions shown in blue, commercial uses shown in red, and transportation structures shown in gray
 However, outsiders did not always view the West End as a healthy community. Instead, people in other parts of Boston viewed it as a slum. My intuition is that this perception of the region came from the large population of immigrants and from the presence of tenement housing on the site. Immigrants, at least upon arrival in the United States, would be more likely to accept low paying jobs, and I am guessing that most of the neighborhood was working or lower class. To the wealthier residents of other parts of Boston, their living conditions may have seemed deficient. Additionally, on the 1885 map of the area there are a few tenement houses, notorious for poor conditions, placed throughout the site, which may have reinforced the image of the West End as a slumxii. Perhaps this perception, along with political incentives for building projects, was why the West End was targeted as part of Urban Renewal. When the West End was demolished, part of my site was torn down with it.
In 1949 and 1954, new urban renewal legislation passed, which incentivized slum clearance and construction of public housing. It accomplished this by providing federal funds for parcel assembly, land clearance, loans to private developers, and infrastructure modernizationxiii. While the purpose of this legislature was to provide the poor of America with better living conditions, the housing authorities in charge of the renewal efforts were often “more anxious to clear slums and to protect real estate values than they were to rehouse the poor”, as Jackson states in Crabgrass Frontier.xiv As a result many cities, Boston included, cleared entire neighborhoods and displaced their residents to make way for new businesses and upscale housing. The West End was one of the first neighborhoods in Boston to suffer this fate.
One can see the drastic changes made to my site by urban renewal in the 50s by comparing maps of the area from 1929 and 1962 (figure 5). The blocks to the south of Cambridge Street remained almost entirely unchanged, but the blocks to the North underwent a complete transformation. The small, packed, residential blocks were demolished and replaced with commercial superblocks. The area between Blossom and Joy Street used to be filled with homes, community and religious centers, and small stores. Now it is occupied by Charles Plaza, a large shopping centerxv. In a period of a few decades, the area lost all traces of its original character and community.
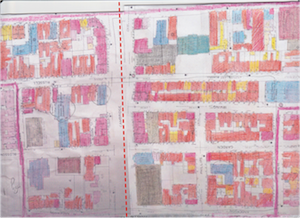 Figure 5a – 1929 – Prior to Urban Renewal (dotted line runs along Cambridge St)
 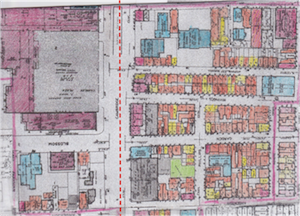 Figure 5b – 1962 – After Urban Renewal (dotted line runs along Cambridge St)
 The sharp contrast between either sides of Cambridge Street puzzles me. Looking at the 1929 map, I don’t see any divide. Both areas are primarily residential and have a similar mixture of schools and religious institutions.xvi There doesn’t seem to be a great difference in socioeconomic status, judging by the presence of tenements on each side of the street in the 1885 map.xvii It is difficult to comprehend why one side of the street was demolished and the other left untouched. One hypothesis is that Cambridge Street marks the boundary between Beacon Hill, a more affluent neighborhood, and the West End, a working class neighborhood sometimes perceived as a slum. The character of the site may seem homogeneous because it lies on the border between two areas, and the neighborhoods mix at this point. However, a difference in jurisdiction or in name may have saved the South side. Alternatively, the street could serve as an arbitrary cutoff point. There may be many other explanations, and it is difficult to tell the reason from maps alone.
Regardless, the northern side of my site was completely redefined as a result of Urban Renewal and its population displaced. This unfortunate event could have been avoided had the government taken a different approach to Urban Renewal.
While immigration and Urban Renewal were changing the face of my site, another force was at work transforming the area: transportation. The first major change appeared on the maps between 1885 and 1929. In 1912, the elevated red line track was constructed, causing major changes to the block enclosed by W Cedar, Cambridge, Grove, and Phillips St.xviii On the 1885 map, the area appears as a packed residential block, but on the 1929 map approximately a third of the buildings have been cleared to make way for the track, which enters the ground at that point.xix See figure 6 for visuals. I am curious about the process by which those buildings were cleared. Did the residents have a choice in the matter? How much notice were they given? How well were they compensated? Soon after this map was published, in 1930 to 1931, the elevated Charles/MGH T Station was constructed around the existing track.xx
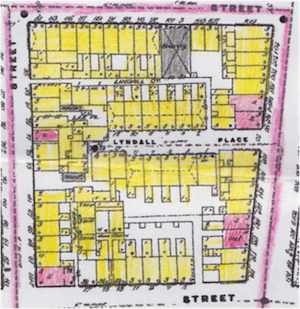 Figure 6a – 1885
 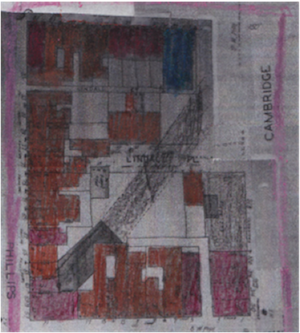 Figure 6b - 1929
The expansion of the T system was the first major transportation change to impact my site; the next was the rise of the automobile. Ford introduced the Model T in 1908, which made automobiles affordable for the common man. By 1927, when production of the model ceased, “the ownership of the automobile had reached the point of being an essential part of normal middle class living”.xxi The rise of the automobile was echoed by a disappearance of stables and appearance of parking garages. On the 1912 map, there are a significant number of stables (represented as buildings with an “x” through them), which indicates that the primary mode of transportation at that time was still horse and buggy.xxii On the 1929 map, however, all of the stables have disappeared and in their place is a proliferation of parking lots and garages.xxiii Refer to figure 7.
As the number of cars used in Boston increased, so too did traffic. It was likely the increase in automobile use, which led to the widening of Cambridge Street between the 1912 and 1929 maps of my site. On the maps one can observe this change in the width of the street and changes to the buildings lining it (see figure 7).xxiv Cambridge Street’s location would have made it a prime route for traveling from Suburbs like Cambridge across the Longfellow Bridge and into downtown Boston. The street was most likely widened so that it could accommodate increased traffic. The construction of Storrow Drive in the 1950s (to alleviate traffic congestion in other parts of the city) probably directed even more traffic along Cambridge Street.
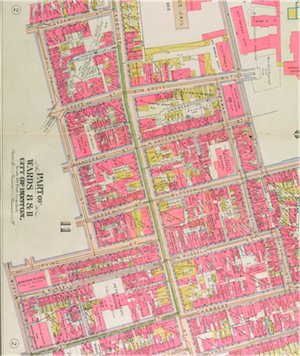 Figure 7a – 1912 – stables are represented by an “x” through a building, Cambridge St is still narrow
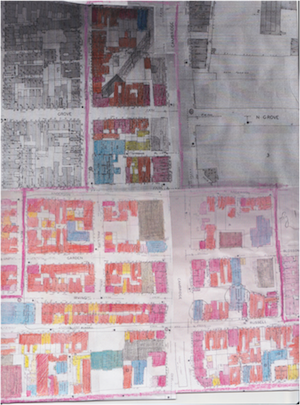 Figure 7b – 1929 – Parking garages are now present, Cambridge St has been widened
The changes one can observe in the T system and the roadways in this area were likely influenced by the expansion of Massachusetts General Hospital, which lies in close proximity to my site. MGH is one of the best hospitals in the United States and one of the largest in New England. As such, it attracts an enormous body of patients, families, doctors, nurses, and other staff. As MGH grew during the 19th and 20th centuries, I suspect that public transit expanded to accommodate its growth and provide avenues for people to reach the hospital more easily. In particular, it lent its name to the Charles/MGH T Station. The construction of Storrow Drive would also have allowed people and ambulances coming from other parts of the city and surrounding areas to reach the hospital more quickly.
MGH seems to have had other impacts on my site as well. It may have triggered the construction of nearby hotels, like the Beacon Chambers Hotel on the corner of Russell and Myrtle Streets. Family members would often come to visit their relatives in hospital and would need a place to stay. This would provide a market for hotels. One can see a more direct impact of MGH in the northwest corner of my site, where the Winchell School was replaced by an MGH building between the 1929 and 1962 maps.
The story of my site is one shaped by immigration, new housing legislature and politics, technological advances, and the growth of Boston’s largest healthcare institution. Between the mid 19th and mid 20th century, it experienced colossal change. Since the 60s, however, it has remained fairly consistent. When one visits today, one can walk through some of the older residential streets of Beacon Hill, traipse around the campus of MGH, eat at small cafes lining the streets, or shop at the Cambridge shopping center. One wouldn’t think of the neighborhood that was lost to Urban Renewal or the narrow blocks that used to occupy the space upon which superblocks now stand. One wouldn’t think about the era when horse and buggies passed through the streets in place of automobiles or when MGH was only a few buildings. By tracing a site’s history through maps, one can get a glimpse into the changes that have occurred over time and the driving forces behind them.
iThe Boston Atlas. Boston: Boston Redevelopment Authority, 2006.
iiKrieger, Alex, David A. Cobb, Amy Turner, and David C. Bosse. Mapping Boston. Cambridge, Mass.: MIT Press], 1999. Print., 8.
iiiIbid.
ivBoston, Massachusetts. New York: Sanborn, 1885, plates 7b, 9a, 9b, and 11a.
vKrieger, Mapping Boston, 8.
vi"Immigrant Era." The West End Museum. N.p., n.d. Web. 4 Apr. 2014.
viiG.M. Hopkins. Civil Engineer. Atlas of the County of Suffolk, Massachusetts 1874. Philadelphia: G.M. Hopkins and Co., 1874, plates M,L, and D.
viiiGeorge W. and Walter S. Bromley Civil Engineers. Atlas of the City of Boston 1912. Philadelphia: GW Bromley and Co., 1912, plates 2 and 3.
ixIbid.
xBoston, Mass. Volume 1N. New York: Sanborn, 1929, plates 21, 27, 28, 29.
xiIbid.
xiiBoston, Massachusetts 1885.
xiiiKrieger, Mapping Boston, 8.
xivJackson, Kenneth T.. Crabgrass frontier: the suburbanization of the United States. New York: Oxford University Press, 1985. Print., 225.
xvBoston, Mass. 1929.; Boston, Mass. Volume 1-N. New York: Sanborn, 1962, plates 21, 25, 26, 28, and 29.
xviBoston, Mass. 1929.
xviiBoston, Massachusetts 1885.
xviii Elkus/Manfredi Architects LTD, "Charles/MGH Station: Design Summary Report." Accessed April 4, 2014. http://www.mbta.com/uploadedfiles/documents/charlesmgh_design_summary_report.pdf., 7.
xvivBoston, Massachusetts 1885.; Boston, Mass. 1929.
xxElkus/Manfredi, “Charles/MGH Station: Design Summary Report”, 7.
xxiJackson, Crabgrass Frontier, 161.
xxiiGeorge W. and Walter S. Bromley Civil Engineers. Atlas of the City of Boston 1912, plates 2 and 3.
xxiiiBoston, Mass. 1929.
xivGeorge W. and Walter S. Bromley Civil Engineers. Atlas of the City of Boston 1912, plates 2 & 3.;
Boston, Mass. 1929.
Boston, Mass. Volume 1-N. New York: Sanborn, 1929, plates 21, 27, 28, 29.
Boston, Mass. Volume 1-N. New York: Sanborn, 1962, plates 21, 25, 26, 28, and 29.
Boston, Massachusetts. New York: Sanborn, 1885, plates 7b, 9a, 9b, and 11a.
Elkus/Manfredi Architects LTD, "Charles/MGH Station: Design Summary Report." Accessed April 4, 2014. http://www.mbta.com/uploadedfiles/documents/charlesmgh_design_summary_report.pdf.
George W. and Walter S. Bromley Civil Engineers. Atlas of the City of Boston 1912. Philadelphia: GW Bromley and Co., 1912, plates 2 and 3.
G.M. Hopkins. Civil Engineer. Atlas of the County of Suffolk, Massachusetts 1874. Philadelphia: G.M. Hopkins and Co., 1874, plates M,L, and D.
"Immigrant Era." The West End Museum. N.p., n.d. Web. 4 Apr. 2014.
Jackson, Kenneth T.. Crabgrass frontier: the suburbanization of the United States. New York: Oxford University Press, 1985. Print.
Krieger, Alex, David A. Cobb, Amy Turner, and David C. Bosse. Mapping Boston. Cambridge, Mass.: MIT Press], 1999. Print.
The Boston Atlas. Boston: Boston Redevelopment Authority, 2006.