All cities are composed of two important systems: the natural environment and the man-made environment. Walking through my site, along the Esplanade, down Charles Street, to the T, and to Massachusetts General Hospital (MGH), I can see evidence of the interactions between these two systems in every detail. This paper will try to share how natural processes have shaped and continue to shape my site, and how my site has shaped nature in return. I will begin with an explanation of the environmental development of my site over the past few centuries to put my observations in context, and then I will walk you through my observations of three main natural processes (water flow, pavement destruction, and plant growth) and try to explain their significance in terms of my site and urban planning in general.
The area surrounding MGH has changed drastically over the last few centuries; the most notable changes have been the filling in of land and the resulting changes to the shoreline of the Charles River. Most of my site lies on filled land, as demonstrated by Figure 1, which shows my site boundaries superimposed on a map of the Shawmut Peninsula in 1630.
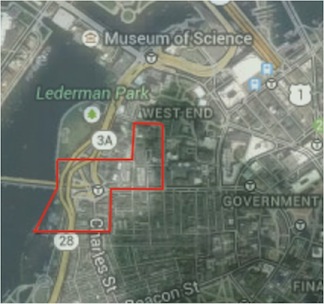 Figure 1 – Map of Shawmut Peninsula in 1630 (dark green area) superimposed on a current map of Boston with my site boundaries outlined in red. 1, 2
The area shown in gray on the map in Figure 1 began as tidal flats, and the city of Boston gradually filled in the flats during the 19th and 20th centuries. This process occurred in stages and for a variety of reasons. The MGH flats were the first area to be filled, because after the construction of the West Boston Bridge in 1793, the tide no longer cleared out the flats effectively. As a result, the flats became a nuisance for MGH, so in 1860 the MGH trustees had the city begin filling the area. 3
The next stage of development was the construction of the Charles River Dam (on the current site of the Museum of Science) and the creation of the Esplanade in 1910. The tidal flats had been a dumping ground for sewage for years, and at low tide the flats, containing raw sewage, were exposed. This exposure created a sanitary issue, since the area took on an unpleasant smell and sight. The Charles River Dam would maintain the river at a constant level and keep the flats covered with water, alleviating the issue. The Esplanade was developed simultaneously as a public green space. 4
The city expanded the Esplanade between 1928 and 1936 and altered the design so that the shoreline sloped down to meet the river rather than end abruptly in a sea wall, as it did in the original design. The sea wall had contributed to rougher waves and made the river a difficult environment to sail in, which only college crew teams braved. This phase of expansion calmed the water and included the creation of a boat haven along the Esplanade to encourage public use of the river. 4
The final phase of development began in 1949 with the construction of Storrow Drive. The highway, which had been proposed years earlier, was finally constructed in 1949 to relieve traffic congestion. The highway was built on the land devoted to the Esplanade, so to compensate, more land was constructed along the shore and converted to a public park. 4
The step-by-step filling of land is depicted in Figure 2 (a map showing the shoreline of Boston in various years), and the development of the Esplanade in particular is visible in Figure 3 (a series of pictures of the Esplanade at each phase of its development).
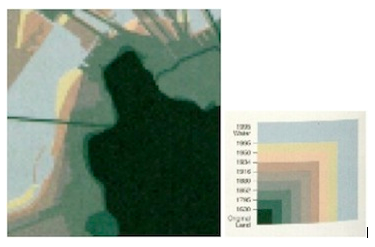 Figure 2 - map depicting the shoreline of Boston at various points in its development 5
 I have gone in to some detail concerning the evolution of the topography of my site because the process illustrates the importance of taking natural processes into account when designing a city. Many periods of landfill were driven by problems that arose due to a lack of consideration for natural processes in a previous era of development. The designers of the West Boston Bridge must not have considered the effect the bridge would have on the tides in relation to the MGH flats, and as a result the flats became an issue and had to be filled in. Similarly, for years, people dumped sewage into the Charles River without thinking about the fact that the sewage would be exposed at low tide and the area would become inhospitable. The Charles River Dam provided a solution to this problem. Finally, when the Esplanade was initially created, the designers built it with a sea wall, without realizing that the wall might contribute to rougher waves. If designers and engineers take natural forces into account when designing structures from the outset, additional construction might not be necessary to correct problems.
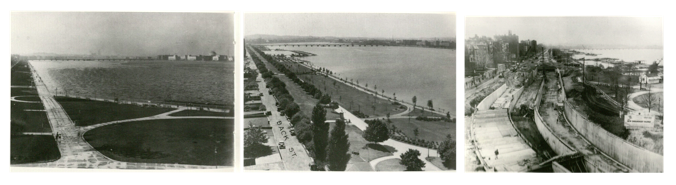 Figure 3 - Photographs of the Esplanade at major stages in its development 6, 7, 8
The fact that my site lies mostly on filled land also raises questions about potential risks or consequences of building on such land. As Anne Spirn writes in “The Granite Garden”, filled land is often less stable than existing land and is at higher risk in the case of natural disasters, like earthquakes, because it is prone to liquefaction. While Boston does not often experience earthquakes, it has a chance of experiencing a high magnitude earthquake, just like cities like San Francisco. 9 It surprises me that a medical center of the scale and importance of MGH and a transportation hub including highways, a major bridge, and a T stop were all built on filled land. In the case of an earthquake, damage to MGH or transportation systems in this area could cause injury to patients and staff at MGH, difficulty in treating injuries, and difficulty in moving people through the city. From looking at maps such as figure 1, I can see that the original building of MGH was constructed on natural land. My guess is that when MGH needed to expand, they had no choice but to build on filled land or relocate. Since Boston rarely experiences earthquakes, it appears that the developers did not give the issue much thought.
I will discuss other influences that filled land can have on city development in the context of specific natural processes in the next part of this paper.
When one takes the time to observe details in the city, one can gain insight into the constant battle between the natural and built environments. The forces that these observations give insight to are not relevant only to a particular site, but to cities across the world, and they can inform the design of urban environments so that the natural and man-made environments can be made to complement, rather than fight, each other. In this next section I will discuss three particular processes which I found evidence of in my site: water flow, pavement destruction, and plant growth.
Urban environments make significant changes to how water travels through the earth. In rural areas, rainwater seeps into the soil and slowly makes its way back to large bodies of water, through the soil or through rivers and streams. In contrast, in urban environments, “the concrete, stone, brick, and asphalt of pavement and buildings cap the city’s surface with a waterproof seal,” as Spirn writes in “The Granite Garden”. 10 This seal drastically reduces the amount of absorption and drastically increases the amount and speed of runoff. The runoff is often channeled away from buildings through a storm drainage system into a nearby body of water. 10 Some evidence of this system can be seen in the design of streets and sidewalks. Often roads are designed with a curved surface that is higher in the center and lower toward the curb, while pavements slope down away from buildings. This design can be seen in Figure 4.
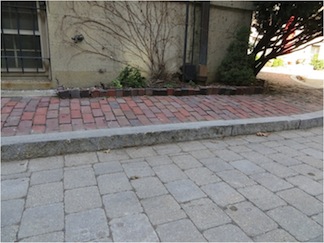 Figure 4 - housing complex along Storrow Dr. Note that the brick slopes downward, away from the buildings. This was most likely an intentional design choice to prevent flooding.
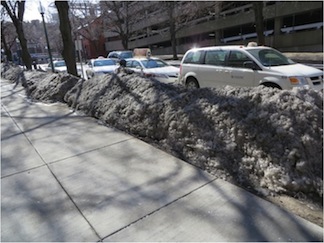 Figure 5 - Pollutants accumulate in the snow bank along the MGH Entrance Road
In the case of my site, which borders the Charles River, it is likely that runoff and water collected through the storm drainage system are deposited in the Charles. While storm drainage systems help to protect buildings, they can have negative effects on the environment. One potential negative impact of this system is that runoff can carry pollutants into the river. Pollutants can include salt deposited on the roads during the winter or airborne pollutants released by automobiles. The presence of airborne pollutants is visible in figure 5, which shows a snow bank along the entrance to MGH. This road receives frequent traffic, so it makes sense that pollutants would accumulate along the road. If such pollutants were carried into the Charles River, they would decrease the water quality.
Water flow through an environment (natural or built) can also cause erosion. In my site this is evident along the riverbank, where the Charles comes into contact with the Esplanade. The lapping of the water along the shore can remove soil from the park and from around the roots of the trees. The fact that the Esplanade was created on filled land may contribute to quicker erosion, but I don’t think it would be a significant change in rate. I visited my site on a cold winter day when the river was frozen, but the action of the waves is preserved by sheets of ice, which have been thrust up against the shore, as visible in Figure 6. It is evident that those in charge of the Esplanade have taken measures to prevent erosion. As shown in figure 7, rocks have been placed at the water’s edge and at the roots of trees to prevent erosion of the soil. A small barrier has also been placed parallel to the shore to prevent soil erosion.
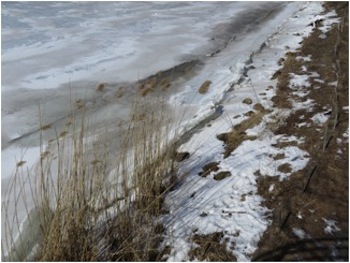 Figure 6 - the motion of waves is preserved in ice
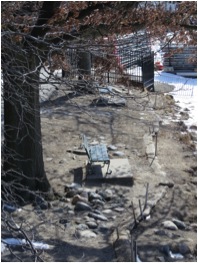 Figure 7 - rocks and barriers have been placed along the water's edge to combat erosion
Water has interesting interactions with structures such as buildings, bridges, and pavements as well. In figure 8, it is clear that water has weathered the fire escape and caused rust to accumulate on the window frame beneath. This is not dissimilar to the erosion of the Esplanade described above. The water flow has also caused a discoloration of the brick.
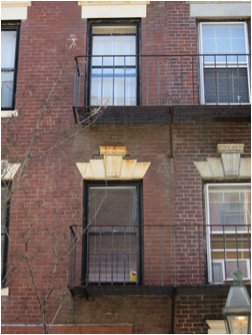 Figure 8 - water rusts a fire escape and causes discoloration in brick
It is important for designers to consider the effects that water will have on their buildings. The same holds true with the design of bridges and pavement. As you can see in Figure 9, there must be a hole somewhere in the bridge, which is allowing water to trickle down and accumulate in one spot on the pavement below the bridge. When the water freezes, it expands, and can begin to break apart the pavement and create frost heaves. In cities like Boston, which experience frequent freeze and thaw cycles during the winter, this process can have important impacts on the structural integrity of the pavement. The frost heaves are apparent in Figure 10, which shows a cover in the street that has sunk into the ground due to cracks that widened around its edges. Presumably, water seeped into the boundary between the metal and the asphalt and caused the cracks to widen. Designers and engineers can avoid some damage to pavements by improving drainage and ensuring that water does not accumulate in once place.
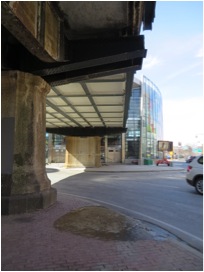 Figure 9 - water has accumulated and frozen on the pavement below a crack in the overpass near the Charles St Station
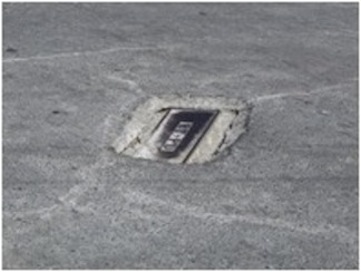 Figure 10 - a metal cover has sunken into the pavement; presumably, water aided this process.
Pavement damage can come from other sources as well, many of which James Elkins discusses in “How to Use Your Eyes.” One cause of cracks is settling, which is often more extreme in areas of filled land. This phenomenon is often observed near the foundations of buildings. For instance, in Figure 11 you can see a crack in the bricks and cement, which run parallel to the edge of the building along Charles Street, a street built on filled land. This is most likely due to settling of the foundation. Another cause of cracking is overuse. This is most likely the case in Figure 12, which depicts alligator (or fatigue) cracking along the exit from MGH onto Storrow Dr. It is clear that the road has been patched several times there. 11
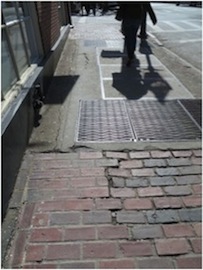 Figure 11 - cracking (most likely due to settling) along a building on Charles St
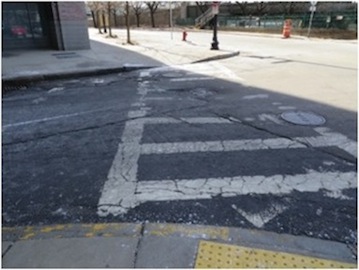 Figure 12 - Alligator cracking along MGH exit
The action of plant growth can also distress pavement. For instance, in figure 13 one can see cracks propagating along the pavement where the roots splay out from the tree trunk. The roots push on the pavement and create cracks, which are most likely exacerbated by the freezing and thawing action of water. In Figure 14 you can see a more extreme example in which the tree roots have caused heaving in the brick and even the metal grate surrounding the tree is tilted upwards. This figure doesn’t only demonstrate the effect of the tree growth on the pavement; it also shows the way that the built environment is trying to control the tree. As the tree continues to grow, the metal plate will begin to constrict its trunk. Perhaps this tree is faring so well (despite its circumstances) because it was planted in a patch of brick, which was laid with dirt or sand rather than concrete. Anne Spirn discusses a similar situation in “The Granite Garden”. She compares the growth of Norway Maple trees, a forest tree which requires about ninety gallons of water per day, on Charles Street and Mt Vernon Street. On Charles Street, which is laid on a concrete base, the trees are stunted and soon die. On Mt Vernon Street, where the bricks are laid in sand, the trees fare better. This difference in growth is because the roots of the Charles Street trees are cut off from water and air, which they need to sustain the tree, by the concrete, whereas on Mt Vernon Street the sand gives them enough access to allow them to grow. 12
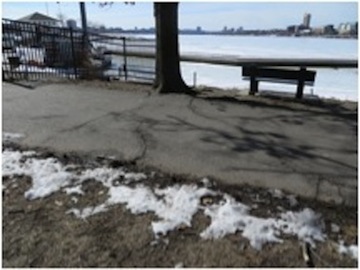 Figure 13 - cracks propagate along paths of tree roots along the Esplanade
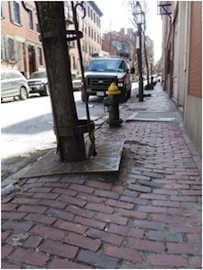 Figure 14 - A tree's growth forces up the pavement
This example points out important considerations people must make when planting trees in an urban environment. In order to survive, trees must have adequate space and soil as well as access to water and air. However, as Spirn writes, “the composition and arrangement of these plants are functions of land use and fashion rather than natural processes.” 13 For instance, one can often find rows of the same species of tree lining either side of a roadway. However, often one side of the road will have conditions that are not as well suited to the trees survival as the other. In these cases, what were meant to be two identical rows of trees will become one normal row and one stunted row. This case is true with the rows of trees on either side of Storrow, as shown in figure 15. The trees on the Esplanade side have more room to grow, while the rows on the embankment between the roads have limited space and don’t grow as tall. A final factor to consider when planting trees in an urban environment is access to sunlight. In many cases, trees may be planted in the shade of buildings or other larger trees, and might grow slanting towards the sun, like the tree in Figure 16.
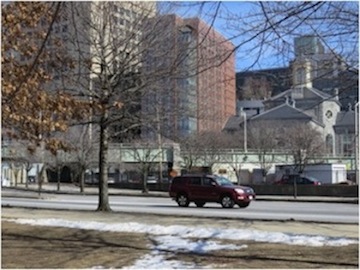 Figure 15 - trees on the Esplanade side of the road grow taller than trees on the center embankment
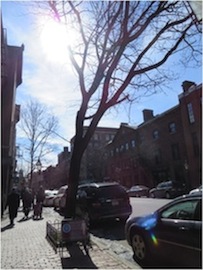 Figure 16 - a tree grows away from the side of a building along Charles St
What all of the above examples have in common is that they demonstrate how there is a constant give and take between nature and the built environment. As much as natural processes shape the city, the city also alters nature. Urban planners can find ways to design the city to incorporate natural processes and create a system in which the natural and man-made environments complement one another. All too often though, people think of the city and nature as two separate entities and ignore what natural processes are telling us. As a result, they create systems that harm both nature and urban structures. Once designers begin to think of the city as an interdependent system of human and natural processes, we will begin to see amazing strides in urban planning.
1 Herb Heidt and Eliza McClennen. Cartography By Mapworks. Scale unknown. Norwell, MA. In: Alex Krieger. Mapping Boston. MIT Press, 1999, 16-19.
2 Boston, MA. (04 Mar. 2014). Sanborn and Google Maps. Google. Retrieved from https://www.google.com/maps/@42.3642551,-71.0657219,1953m/data=!3m1!1e3
3 Seasholes, N. (2003). Gaining Ground: A History of Landmaking In Boston. Boston: MIT Press, 187
4 Krieger, A. (1999). Mapping Boston. Boston: MIT Press, 132-136
5 Herb Heidt and Eliza McClennen. Cartography By Mapworks. Scale unknown. Norwell, MA. In: Alex Krieger. Mapping Boston. MIT Press, 1999,
6 Courtesy of the Massachusetts State Archives. In: Alex Krieger. Mapping Boston. MIT Press, 1999, 136
7 Courtesy of the Massachusetts State Archives. In: Alex Krieger. Mapping Boston. MIT Press, 1999, 140
8 Courtesy of the Massachusetts State Archives. In: Alex Krieger. Mapping Boston. MIT Press, 1999, 144
9 Spirn, A. (1984). “The Granite Garden”: Urban Nature and Human Design. New York: Basic Books, 19
10 Spirn, A. (1984). “The Granite Garden”, 130
11 James Elkins, How to Use Your Eyes (Routledge, 2000): "How to Look at Pavement." 28
12 Spirn, A. (1984). “The Granite Garden”, 177
13 Spirn, A. (1984). “The Granite Garden”, 179
Boston, MA. (04 Mar. 2014). Sanborn and Google Maps. Google. Retrieved from https://www.google.com/maps/@42.3642551,-71.0657219,1953m/data=!3m1!1e3
Courtesy of the Massachusetts State Archives. In: Alex Krieger. Mapping Boston. MIT Press, 1999
Herb Heidt and Eliza McClennen. Cartography By Mapworks. Scale unknown. Norwell, MA. In: Alex Krieger. Mapping Boston. MIT Press, 1999
James Elkins, How to Use Your Eyes (Routledge, 2000): "How to Look at Pavement."
Krieger, A. (1999). Mapping Boston. Boston: MIT Press
Seasholes, N. (2003). Gaining Ground: A History of Landmaking In Boston. Boston: MIT Press
Spirn, A. (1984). “The Granite Garden”: Urban Nature and Human Design. New York: Basic Books