As one of the oldest and most historic neighborhoods of Boston, the North End has seen its share of big changes throughout the more than 300 years since it was settled. My site in particular is located in the heart of the North End and has been on firm land even before the filling of the Mill Pond. As a consequence, it has developed in a compact manner and has been growing ever denser. Without much room for expansion, the overall structure of the site has been more or less constant and the lay of the streets has changed very little even after the nineteenth century, which Jackson describes as a period when “America’s largest cities underwent a dramatic spatial change” (20). This is not to say, however, that there have not been any significant changes. In fact, the most relevant changes take place at the smaller per-building scale; the type of buildings that were present at a certain time and their replacing for other types. Some of these small changes are in fact the most revealing, such as churches representing particular ethnic groups being present at particular periods.
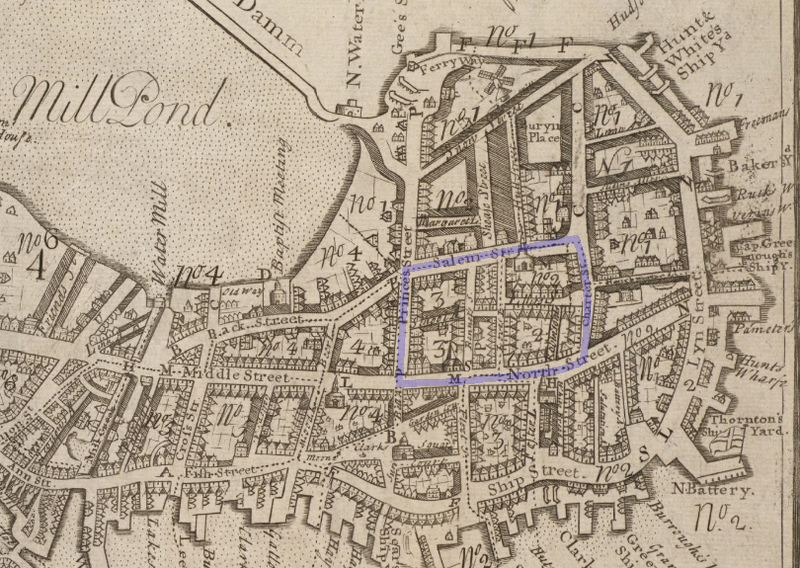 A 1743 map of Boston by William Price, found in the Boston Public Library. Wikimedia, http://commons.wikimedia.org/wiki/File:1743_Clark_Square_NorthEnd_Boston_map_WilliamPrice_BPL_10913_detail.png
General Trends
Just as one can learn a lot from the changes that take place in a zone, the things that stay the same can also be of interest towards our understanding of the site. A general trend or characteristic of the site that changes very little could imply that it is something very important or representative of it. In the case of the North End, the land use has always been mainly just residential and institutional, as is arguably to be expected of an old historic neighborhood.
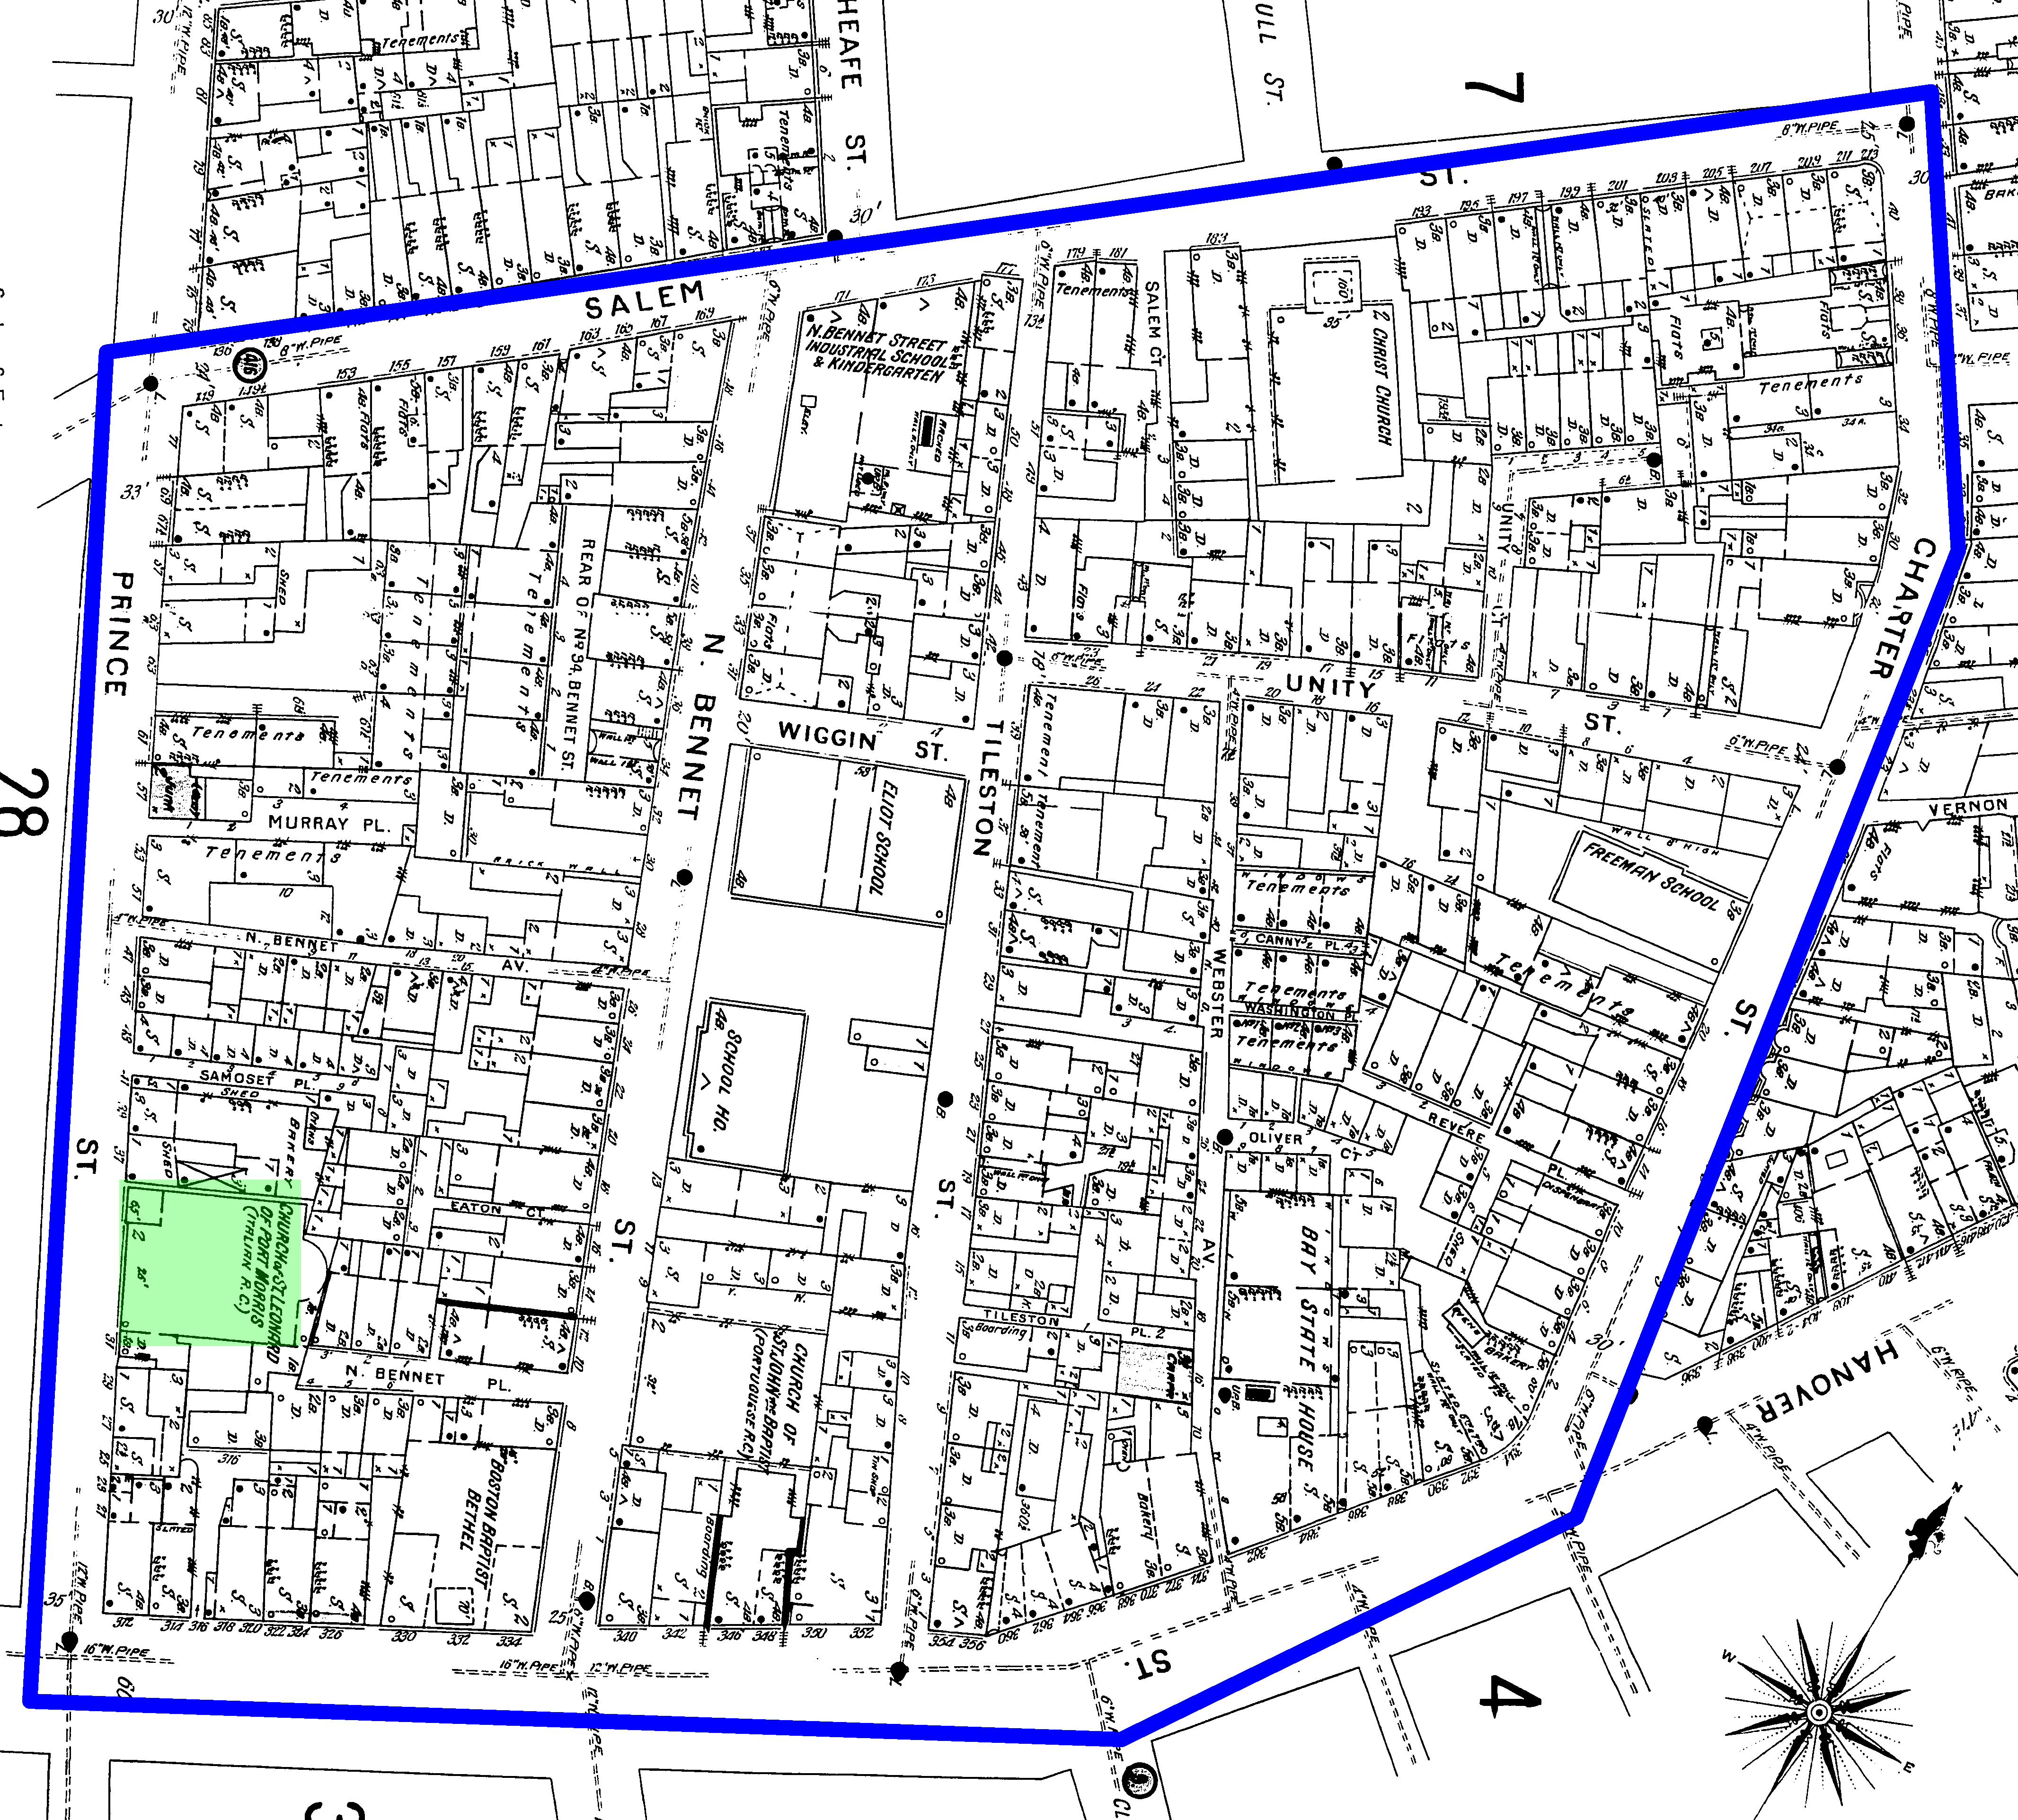
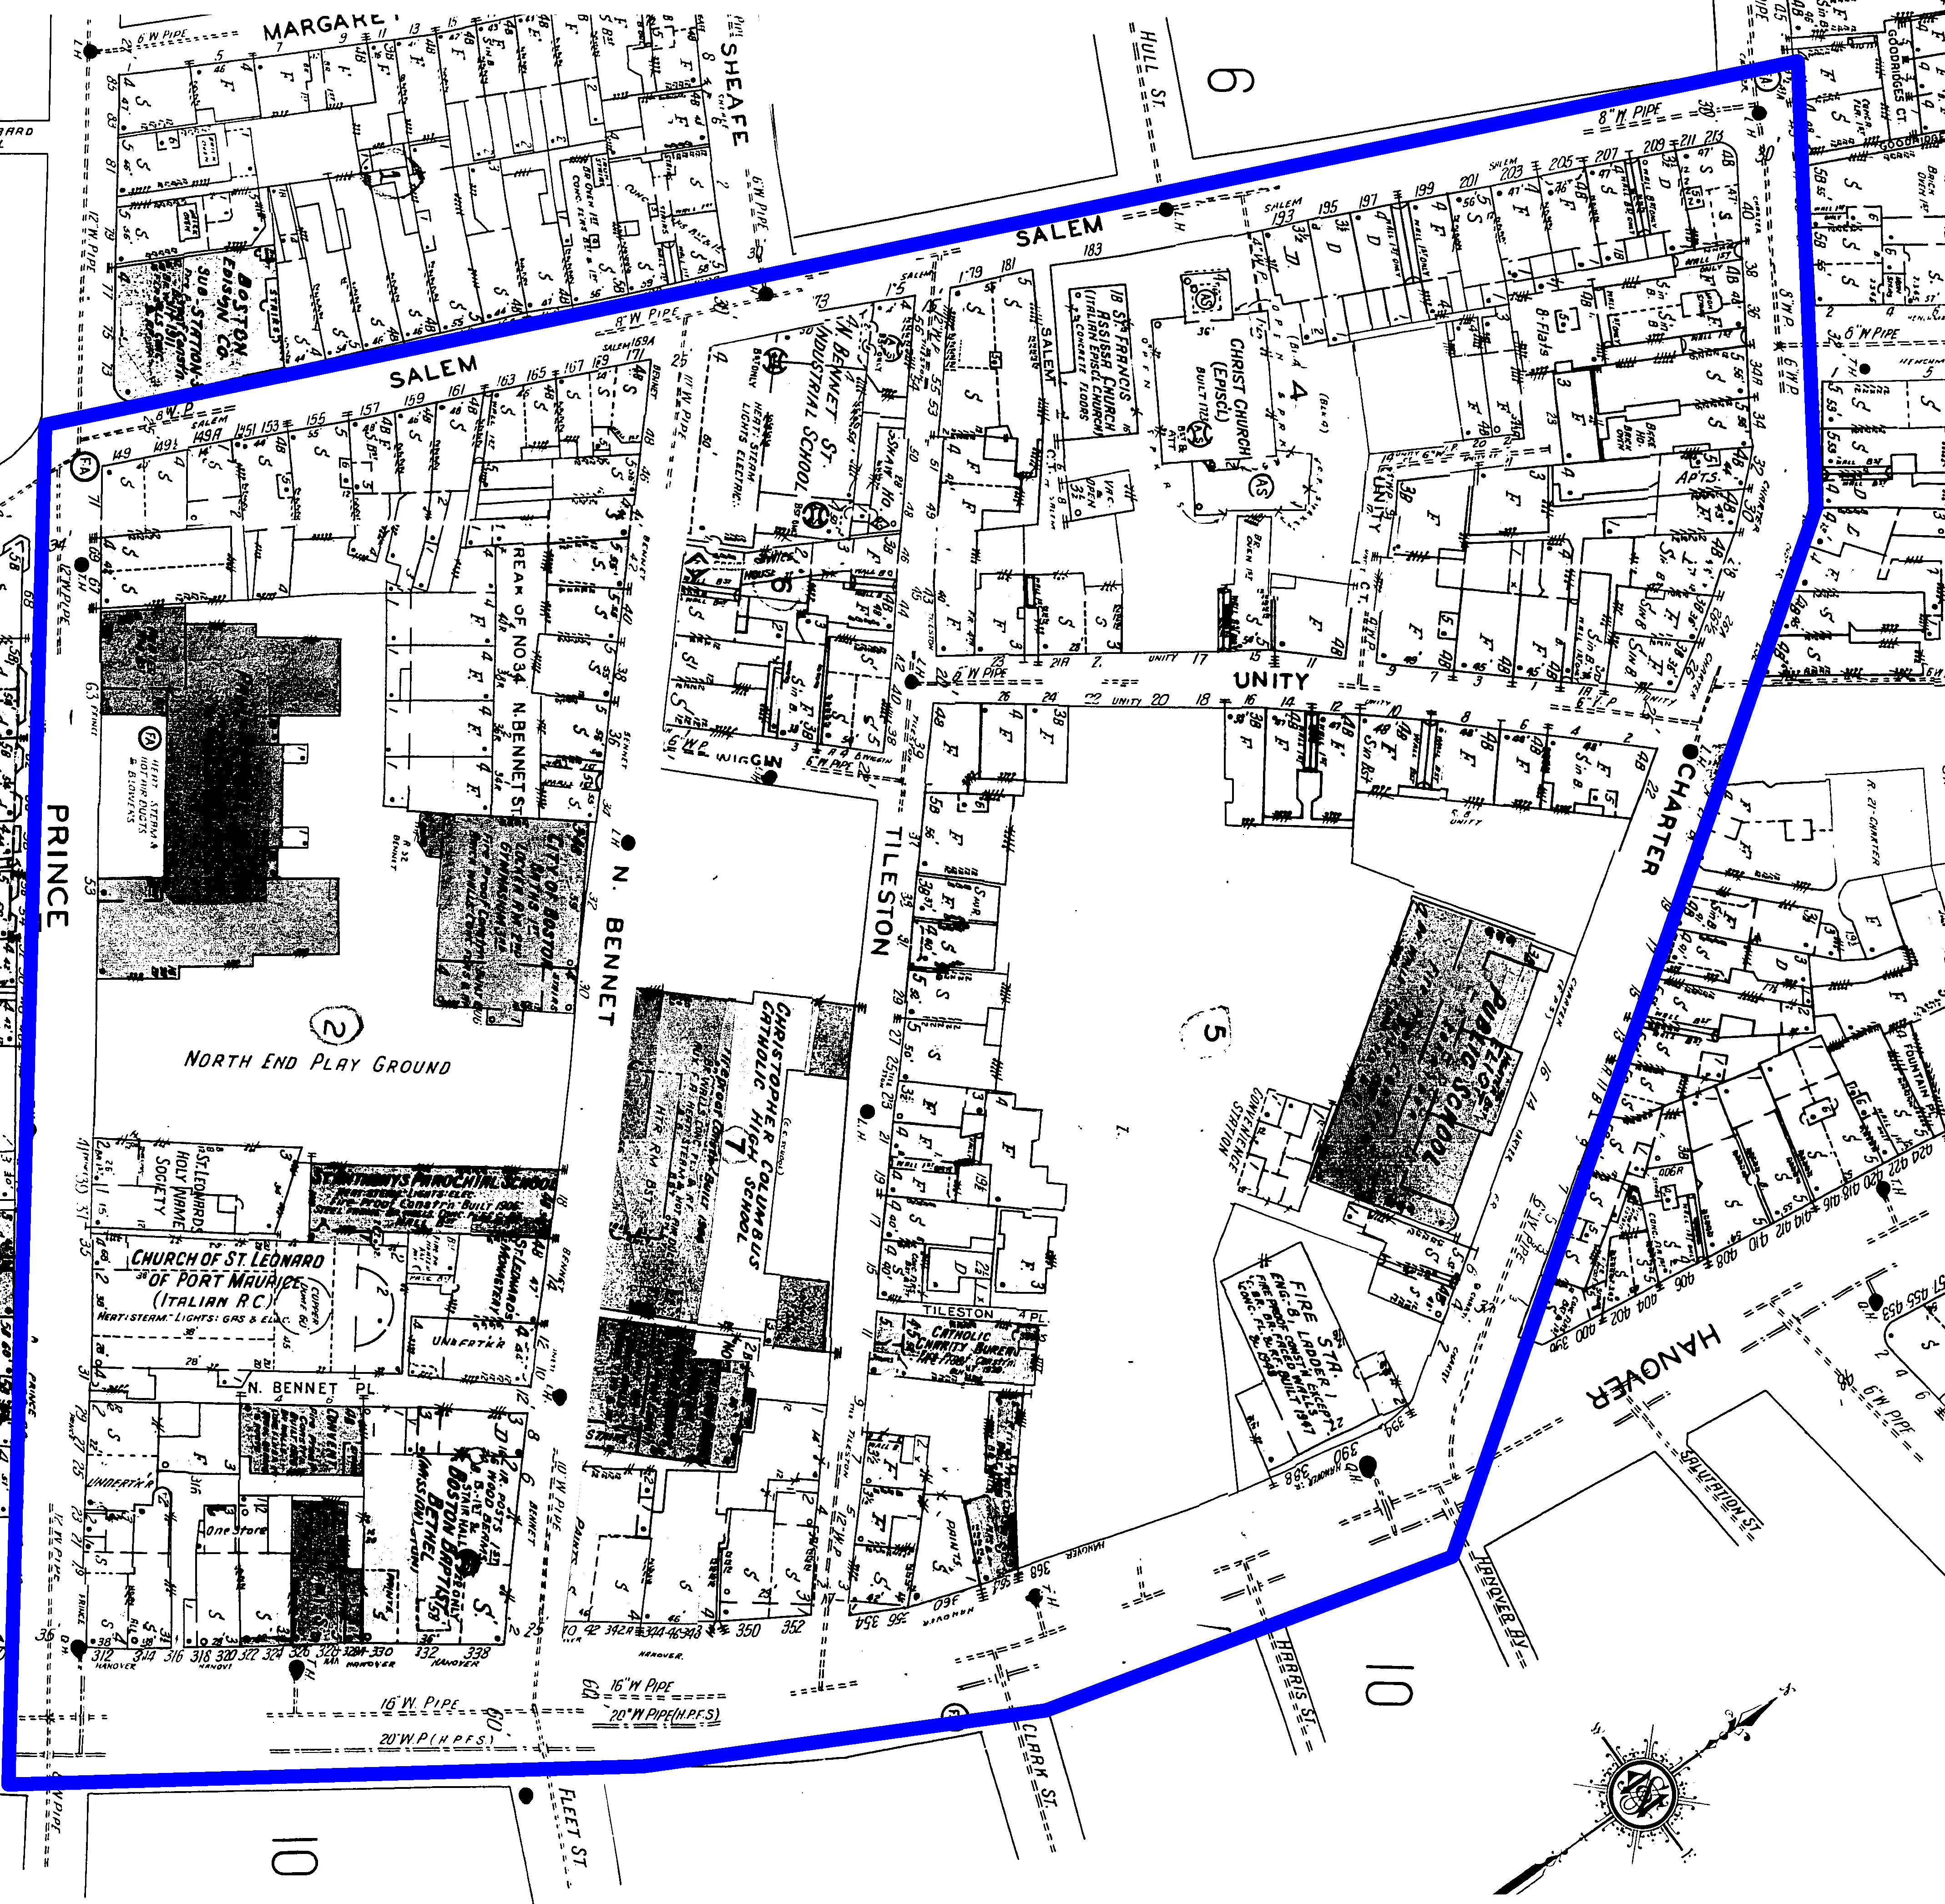
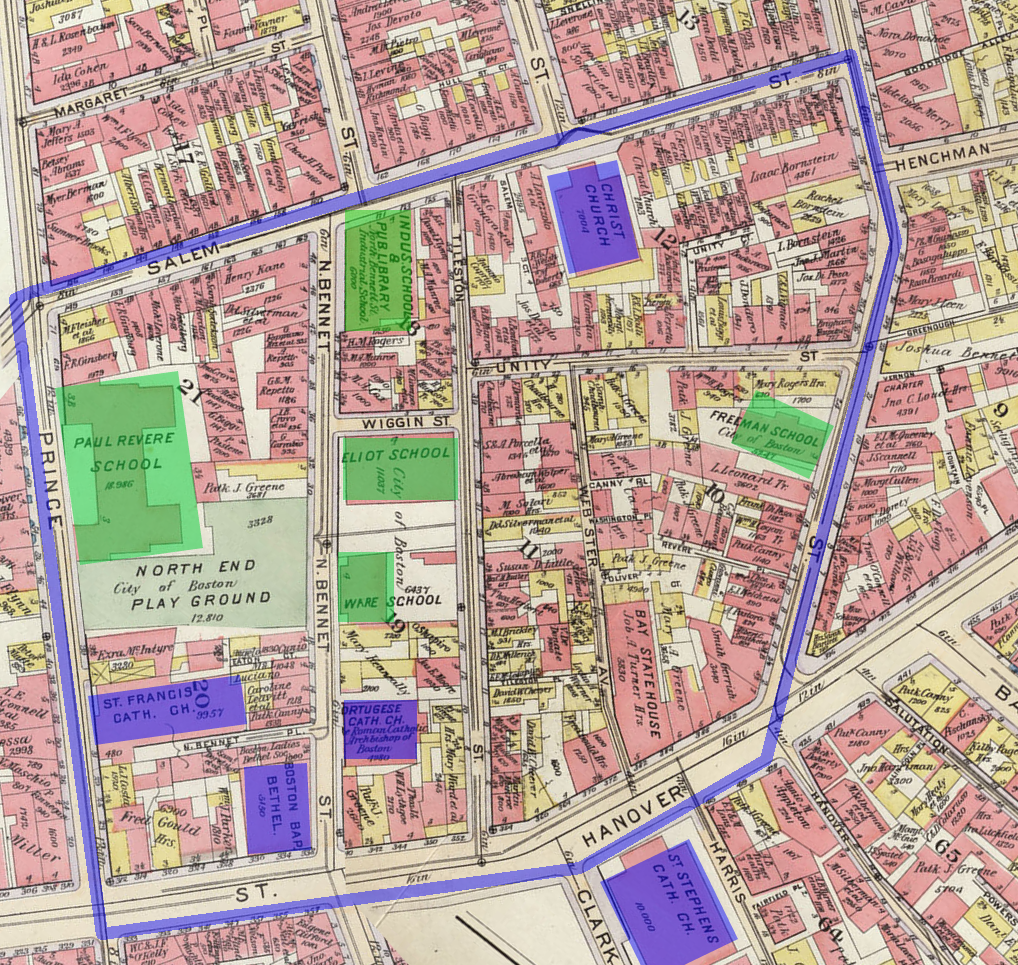 (Click to enlarge) A map of North End during 1902 showing all the schools in green and churches in blue.
Bromley, G. W. Atlas of the City of Boston, Boston Proper, and Back Bay from Actual Surveys and Official Plans. Map. 1902. MIT Lib., Cambridge. Dome. Web. 1 Apr 2014.
My site is especially strong in the institutional field, as the overabundance of schools and churches in particular throughout the years immediately strikes as shocking. Inside the boundaries of my site, churches and schools come and go swiftly from decade to decade, but are always plentiful. At the most extreme point in time, in the first decade of the twentieth century, one can find no less than 5 schools and 4 churches inside of the mere 6 blocks enclosed by the boundaries of my site, plus St. Stephen’s church just outside the boundary. Interestingly enough, this last church and the one in the north, the Christ Church, can be traced back to the oldest map from 1743 and still exist today, so they have stood firm for more than 250 years without so much as changing their name, which is strong evidence of the importance of a long-lasting (though otherwise obvious) Christian culture in the zone. The abundance of schools might be a little more mysterious. In a way, it might be related to a large young generation, so it could be an indicator of a growth in population that is particularly strong during this decade. Indeed, the housing density of the neighborhood at this time is growing quite fast, as we shall see from later maps.
The overall abundance of churches as a general trend, on the other hand, can help us draw some conclusions in a more straightforward way, as it can be attributed to the existence of a great variety of ethnic groups in the North End. Being located at the tip of Boston, the North End served as a port an entry point for immigrants coming to the new continent from all around the world; hence it is only natural to expect the setting of the North End to be particularly responsive towards the different waves of immigration that took place, which can be confirmed by looking at the churches of various sects that come and go in each period.
As mentioned earlier, another general trend is the constant lay of the streets. The four streets that bound the site – Hanover Street, Prince Street, Salem Street and Charter Street – remain unchanged since the earlier map in 1743 to date. Hanover Street, formerly named North Street, is the only one to receive a name change, but in fact none of the streets ever change physically with the sole exception of Webster Avenue, which will be destroyed around the 1930’s for the construction of the Paul Revere mall. This lack of change or growth in the streets is a result of the site being densely packed by its surroundings from the very beginning, and is the cause today of heavy traffic congestion in the neighborhood.
Early Setting
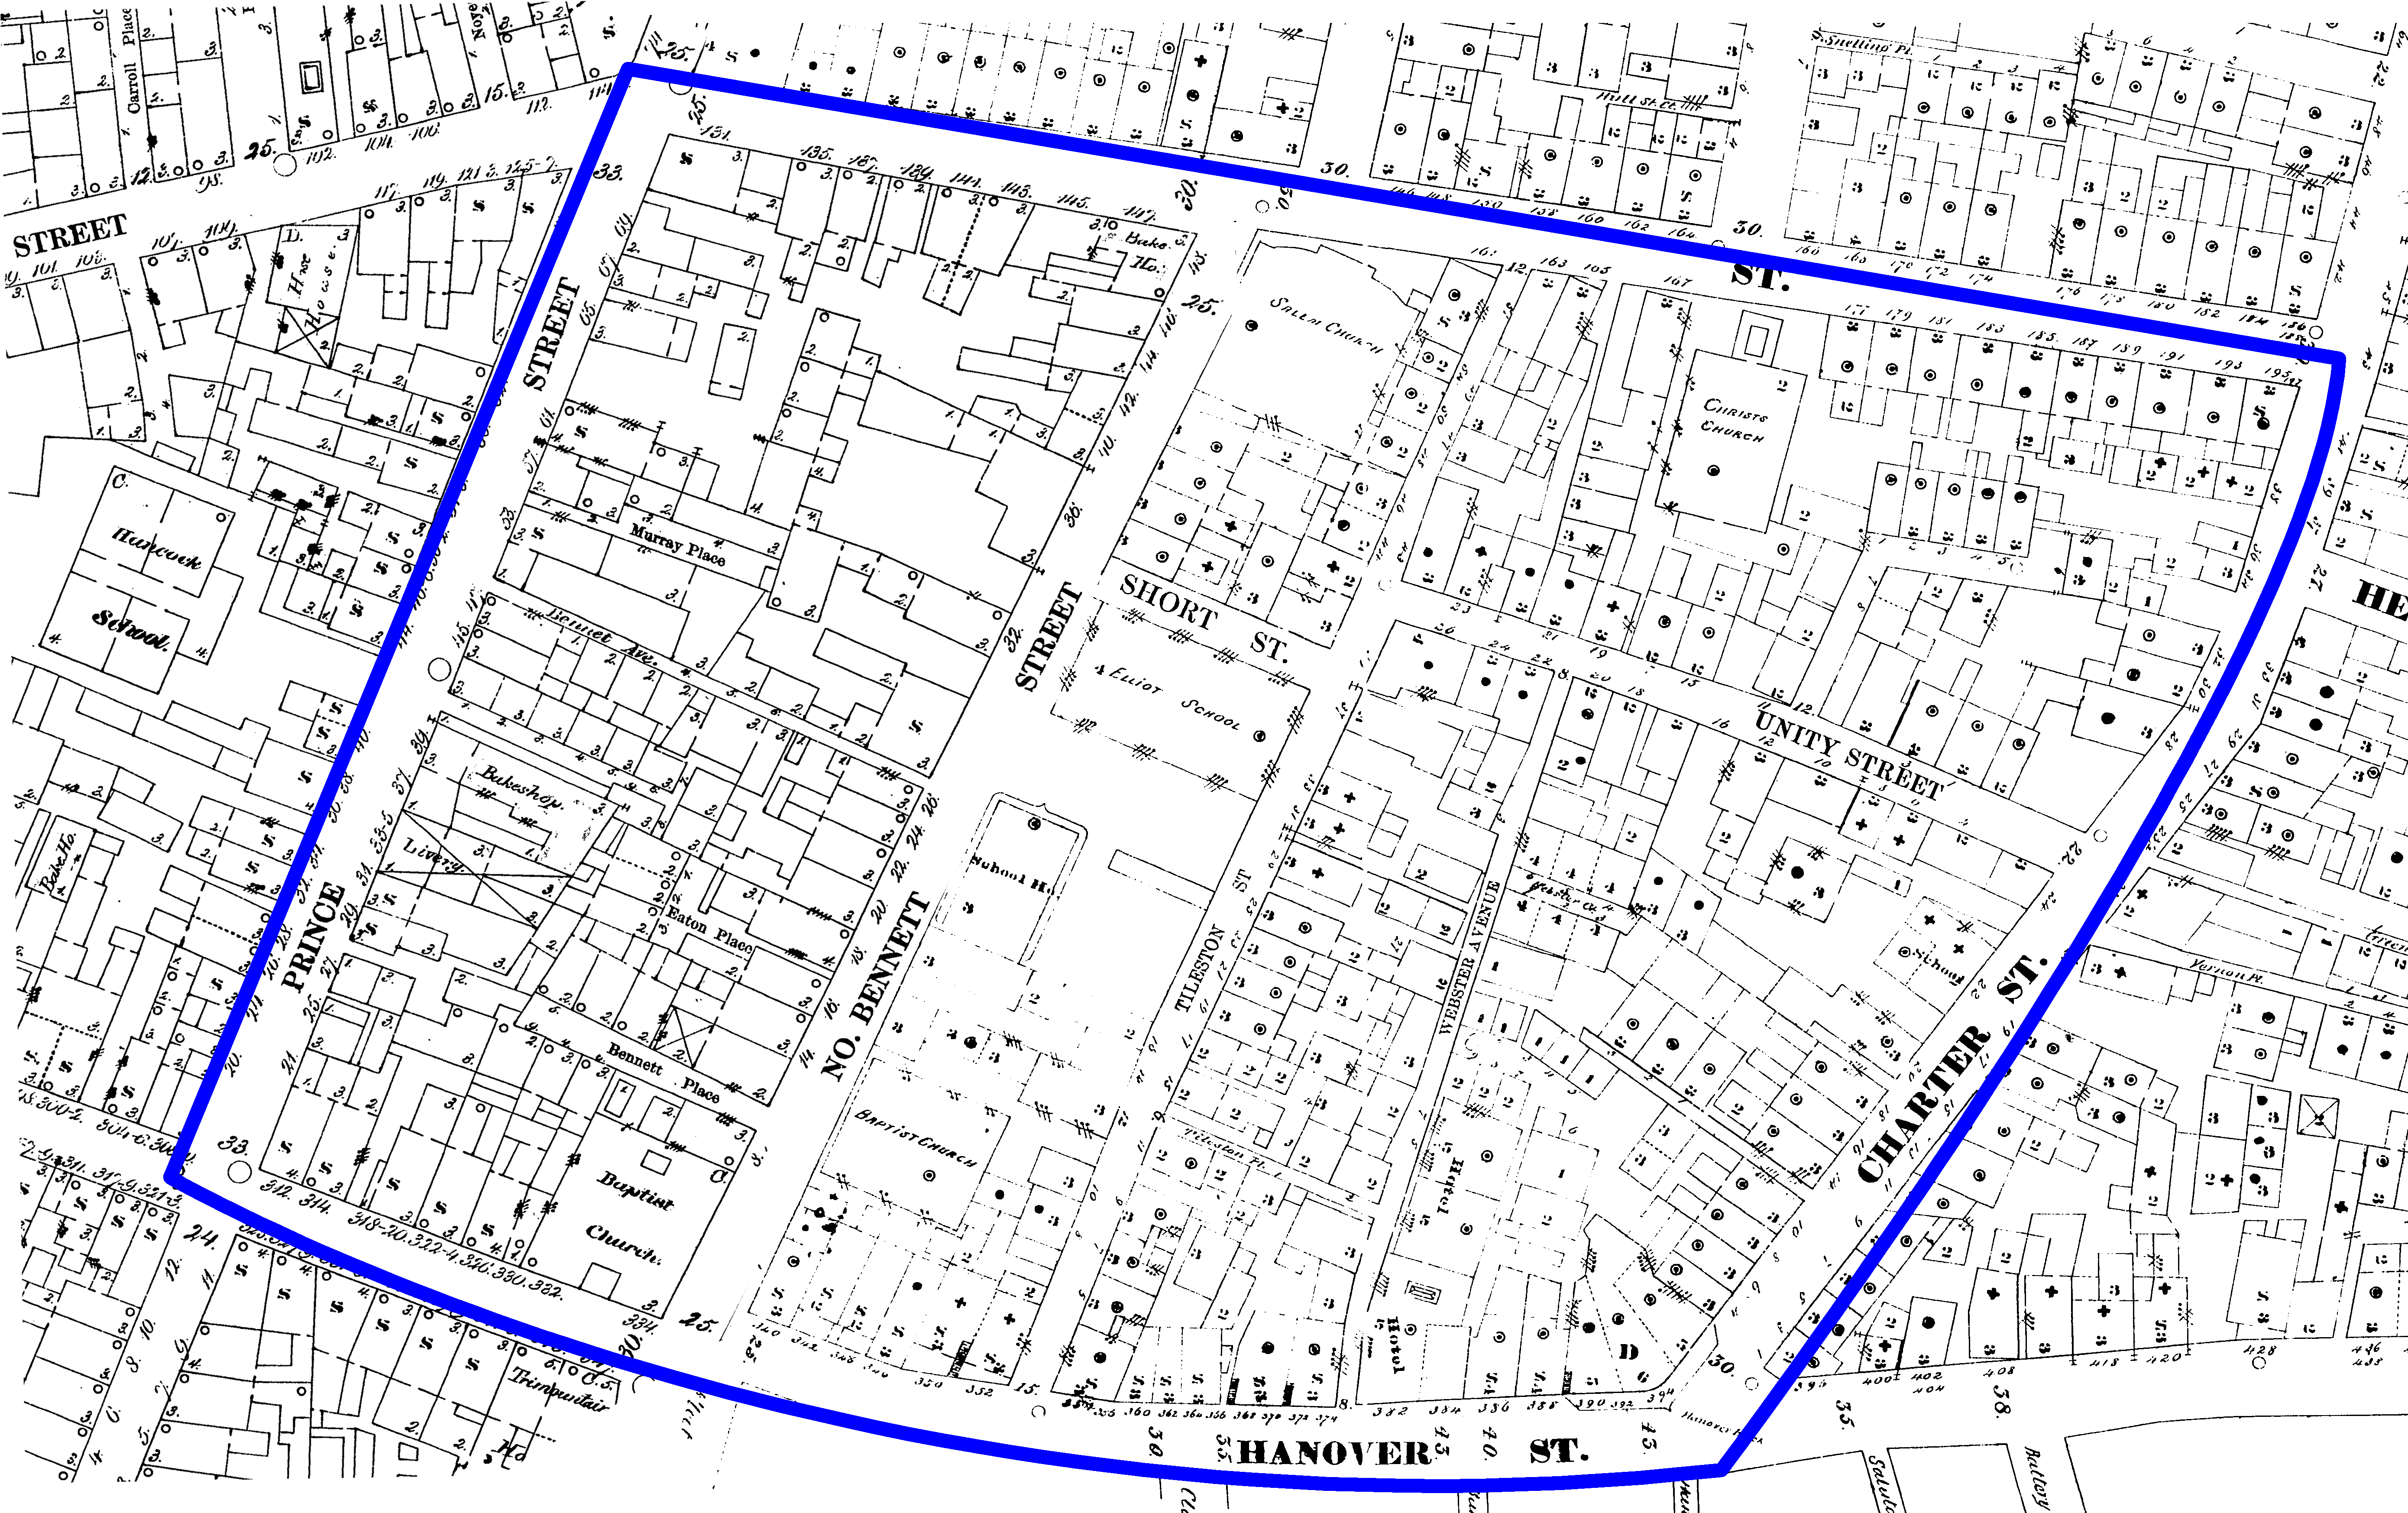 (Click to enlarge) A map of North End during 1867.
Sanborn, Daniel Alfred. Insurance Map of Boston. Map. 1867. Digital Sanborn Maps. Web. 15 May 2014.
The earliest detailed map of the zone available comes from 1867, and already has four churches (plus St. Stephen’s, not visible in the image) and three schools. Two Baptist churches lie in front of each other across Bennet Street, and a much bigger church named Salem Church lies over Salem Street in the north. Just south of it, Elliot School is the biggest school at the time. Other than these institutions, the whole zone is used almost exclusively for housing, with the east half and the south-west appearing to be the most densely populated areas. There are a couple of buildings labeled as hotels over Webster Avenue, but other than that businesses are scarce.
The Portuguese and Irish Immigration
After 1850, immigration from Ireland to Boston was at its peak after the Great Famine in 1846 forced thousands of Irishmen out of their homeland (Warner 8). This great immigrant influx would undoubtedly have a great effect on the North End. Such effect was not visible immediately in the maps around this map, but by the 1880’s we can find several hints of Irish as well as Portuguese influence.
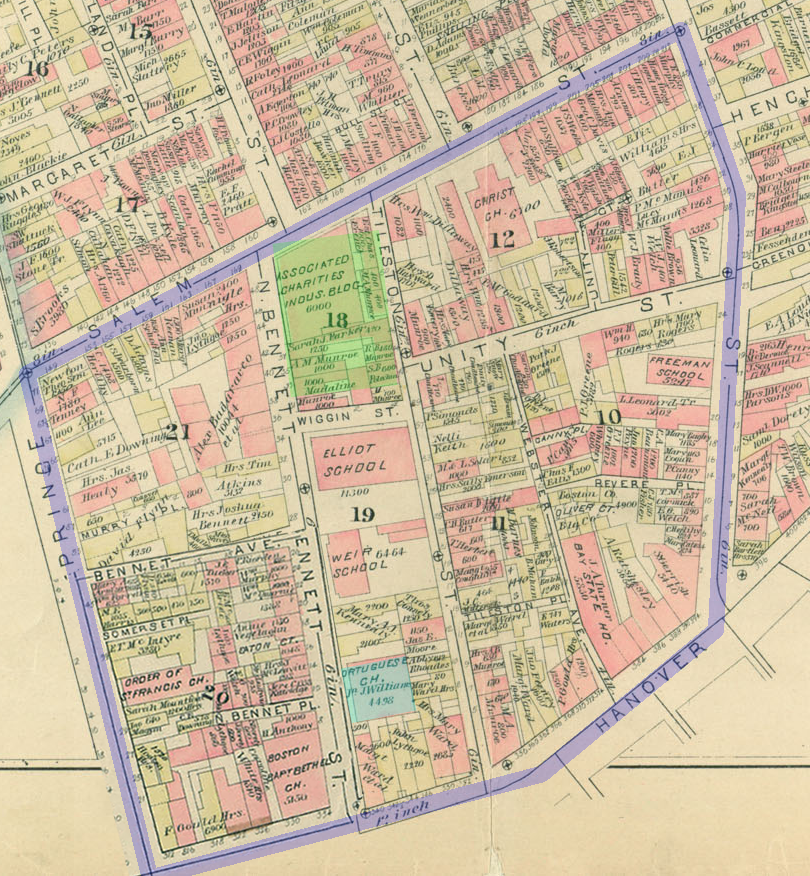 (Click to enlarge) A 1883 map of Boston. The Salem Churchhas been replaced (in green) and one of the Baptist churches has been replaced by a Portuguese Catholic church (in blue)
Bromley, G. W. Atlas of the City of Boston, Boston Proper, and Back Bay from Actual Surveys and Official Plans. Map. 1886. MIT Lib., Cambridge. Dome. Web. 1 Apr 2014.
In the map above, from 1883, it is quite easy to find Irish names among the property owners, and a few Portuguese names can be located as well. Also, the biggest church in the previous map, Salem Church, disappears and is now replaced by a charity building. This can be thought of as a general trend during this period, when the original protestant churches from the early Boston start losing strength as they enter into conflict with the mainly Catholic Irish and Portuguese immigrants. In fact, this point is made even stronger by one of the couple of Baptist churches near the south-west, which has now been directly replaced and now reads “Portuguese Catholic Church”.
A few other changes taking place at the time are that the hotel buildings over Webster Avenue are now combined to form the Bay State House and Short Street has changed its name to Wiggin Street, and this is actually the very last change in the streets, even in names, that we will see up to present date (other than the destruction of Webster). The three previously mentioned schools now show up with their respective names – Freeman School, Weir School, and Elliot School. It is also possible at this time to find a couple of instances of the name “Leonardo” and other Italian names at this point, hinting at the next immigration wave.
The Italian Immigration
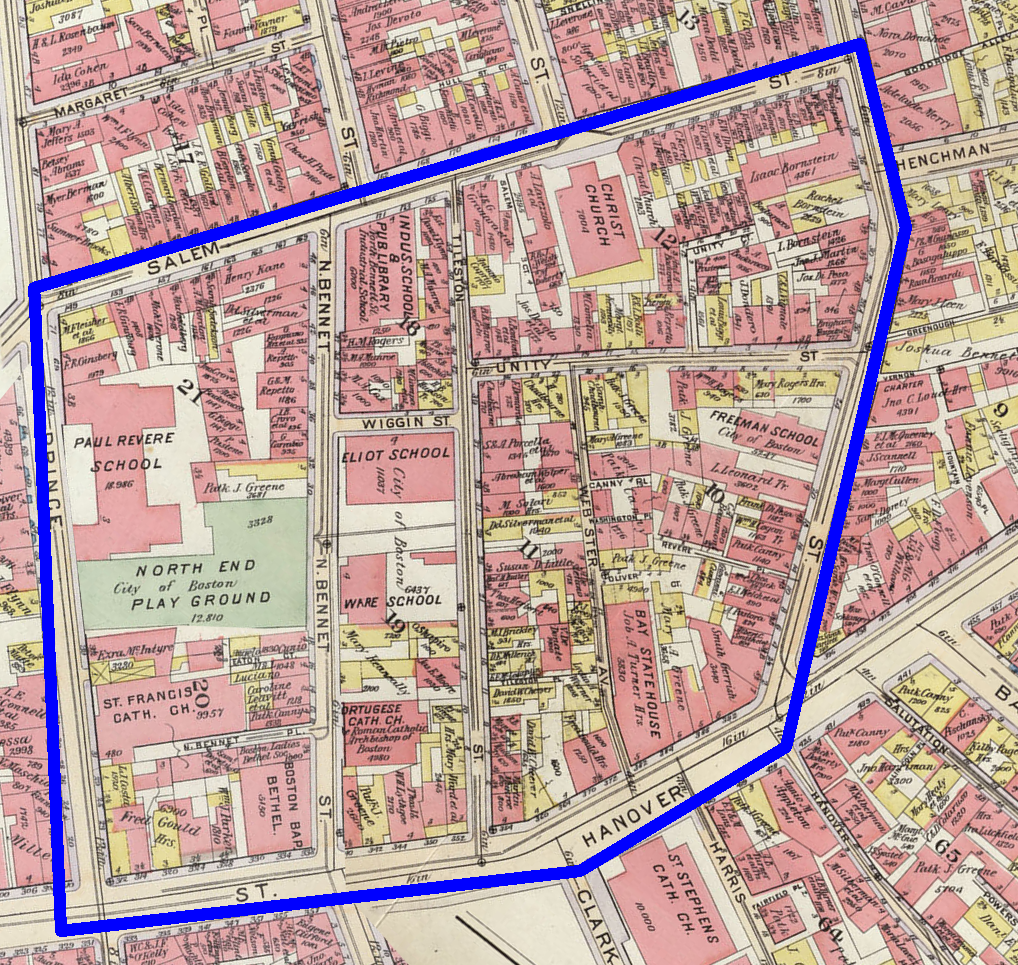
 (Click to enlarge) A map of North End during 1895 showing the Church of St. Leonardo in green.
Sanborn, Daniel Alfred. Insurance Map of Boston. Map. 1895. Digital Sanborn Maps. Web. 15 May 2014.
The North End today is well known for its Italian population, and the first signs of Italian influence on the map can be traced back to the late nineteenth century, shortly after and even with a fair time overlap with the Irish immigration. It is worth keeping in mind that the immigration waves probably happened considerably earlier, as it would take some time for the immigrant groups to prosper and start leaving their marks as house owners.
The first significant sign of this immigration that we can find on the maps, however, is shown in the map to the left from 1895. Located next to the west boundary of the site, the Church Of St. Leonardo serves as evidence of the beginning of the thriving of the Italian culture in the zone that will persist for the next hundred years and to current date. The Church of St Leonardo still stands today, among countless Italian restaurants, gift shops, etc. in the zone, and proudly wears a sign reading “first Roman Catholic Church in New England built by Italian immigrants.” By 1902, the Bromley map below shows that Italian names have started t o completely flood the neighborhood.
 (Click to enlarge) A 1902 map of Boston flooded with Italian names. G. W. Atlas of the City of Boston, Boston Proper, and Back Bay from Actual Surveys and Official Plans. Map. 1902. MIT Lib., Cambridge. Dome. Web. 1 Apr 2014.
 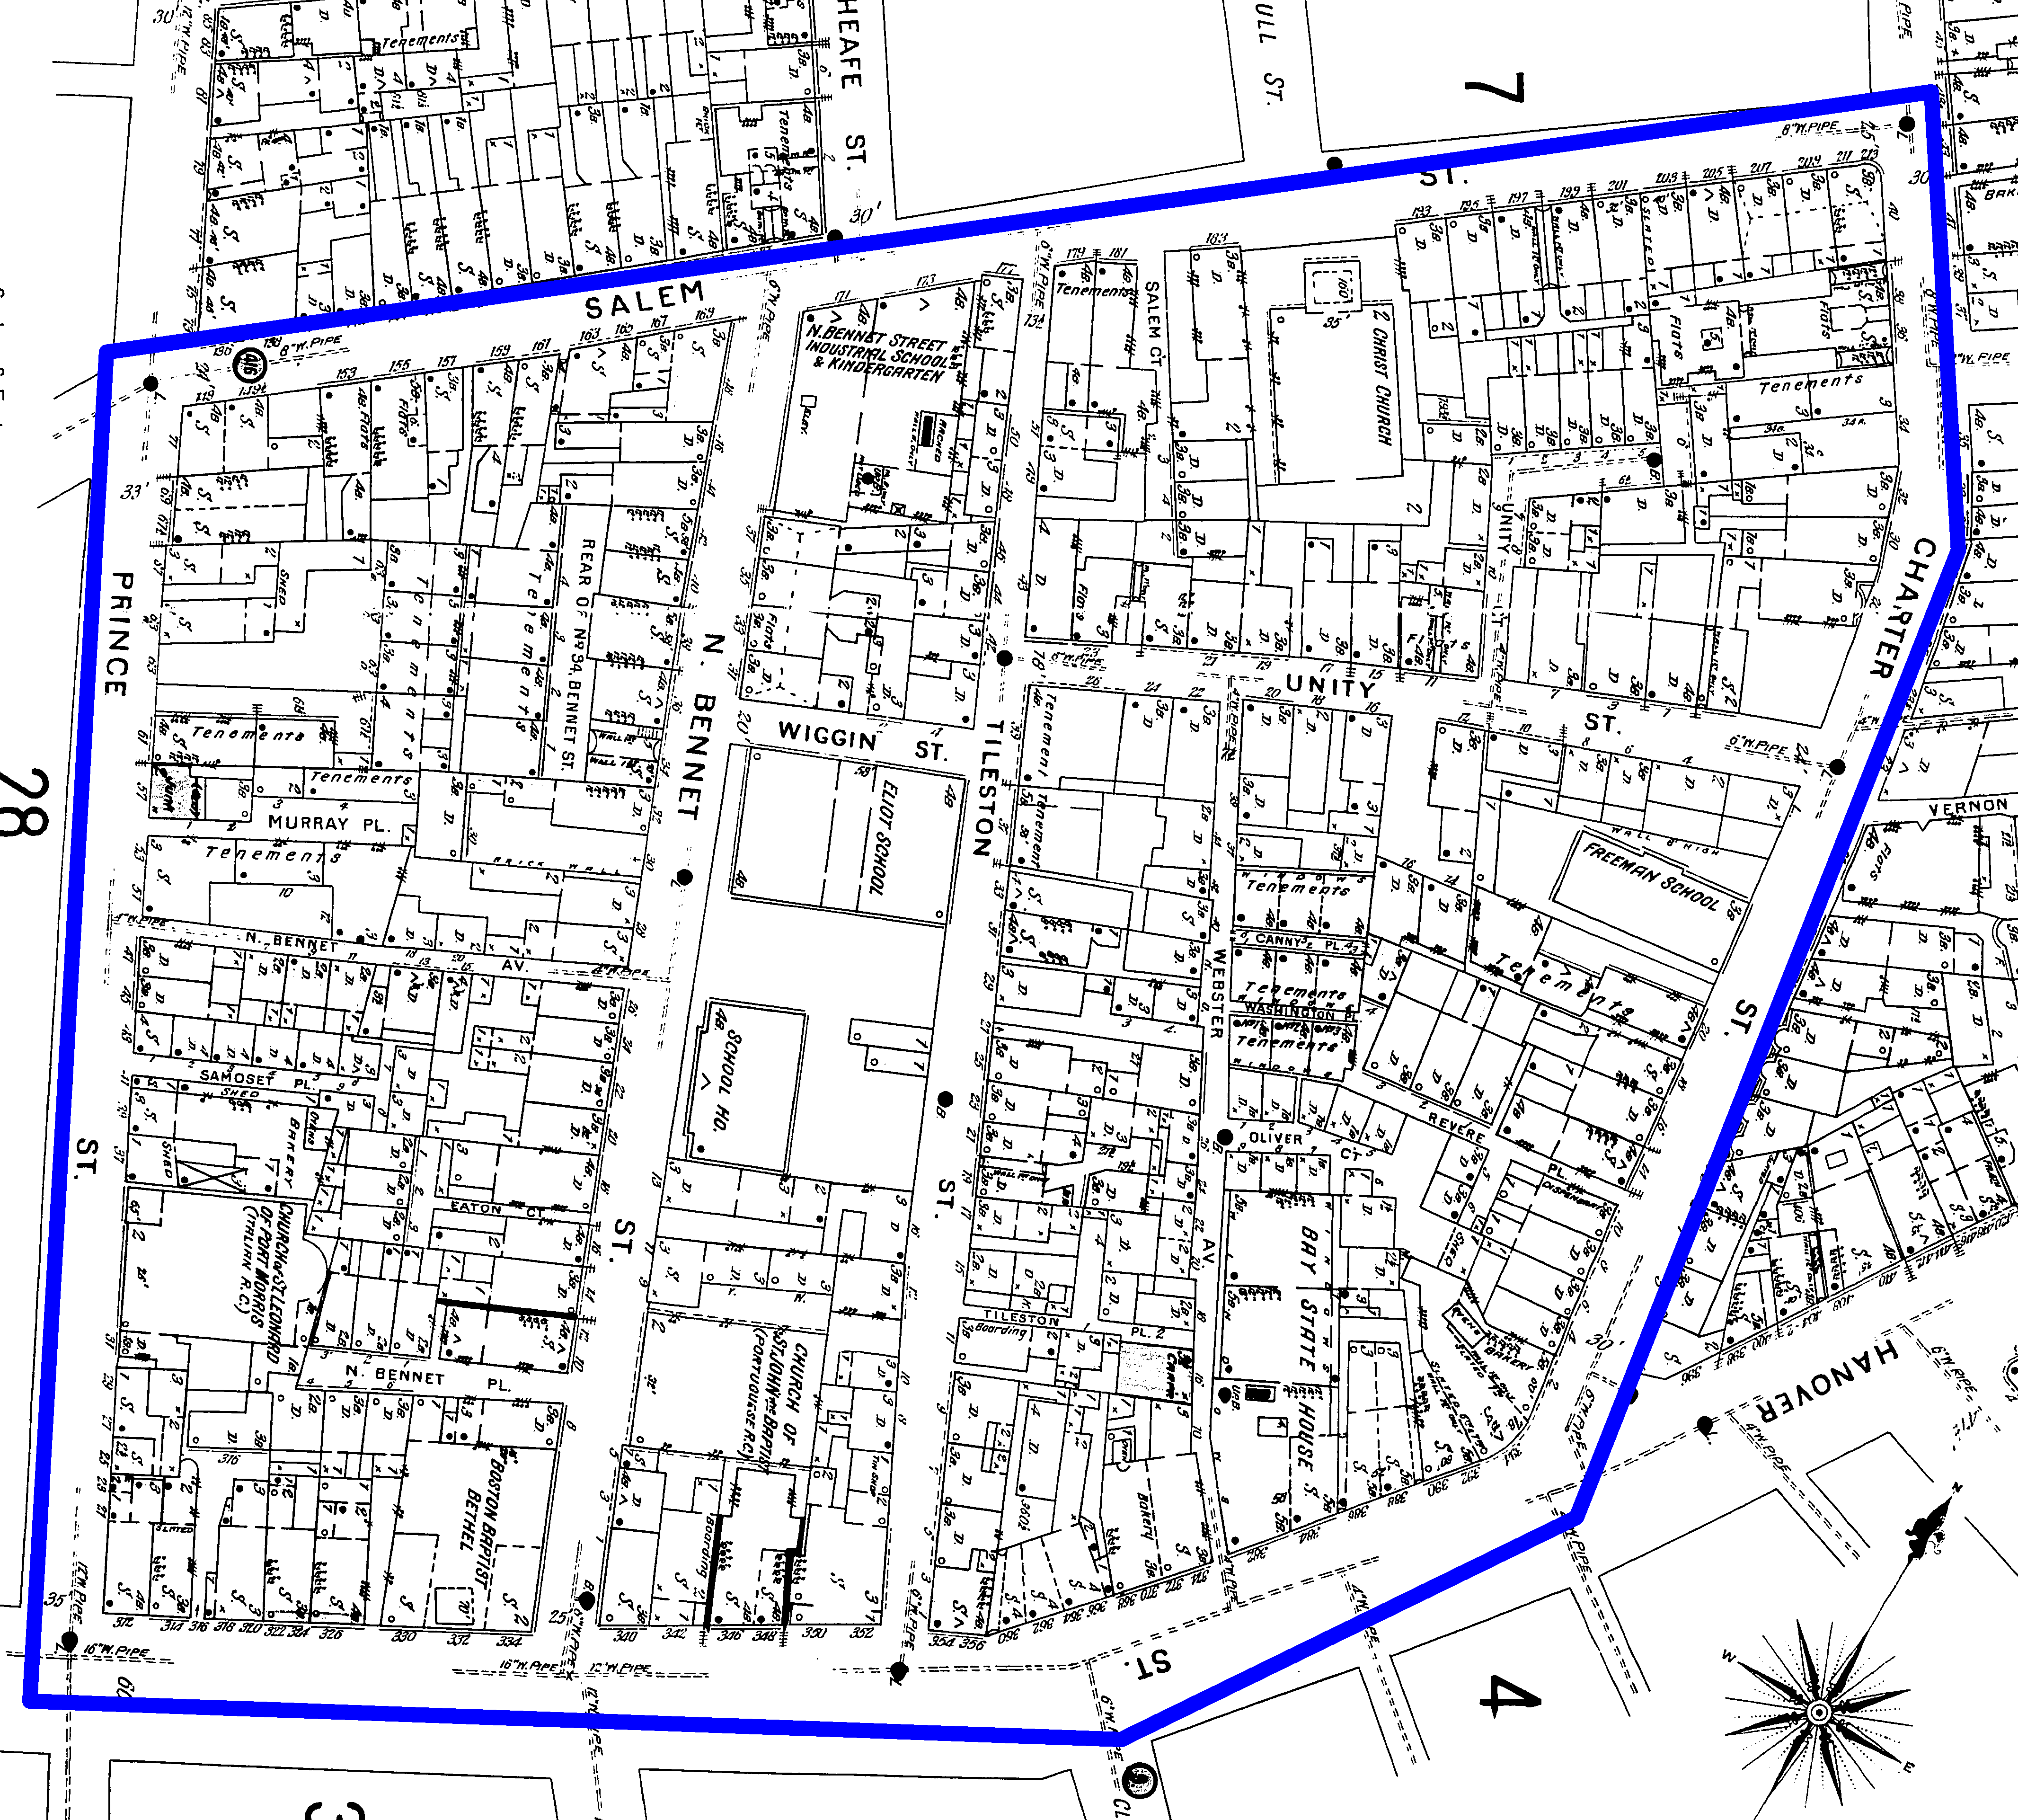 (Click to enlarge)1896 map of North End.
Sanborn, Daniel Alfred. Insurance Map of Boston. Map. 1895. Digital Sanborn Maps. Web. 15 May 2014.
Urban Renewal
Looking back to the 1895 map once more (show to the left again), one very easy thing to note is that the building density has been increasing dramatically during these years, particularly in the areas in the south-east and south-west. Tenements have started showing on the map, and iterations of the word have quickly begun to flood the map, turning them into extremely densely packed, almost residential-exclusive areas. During the twentieth century, however, a series of drastic changes take place that will bring a completely different scenario.
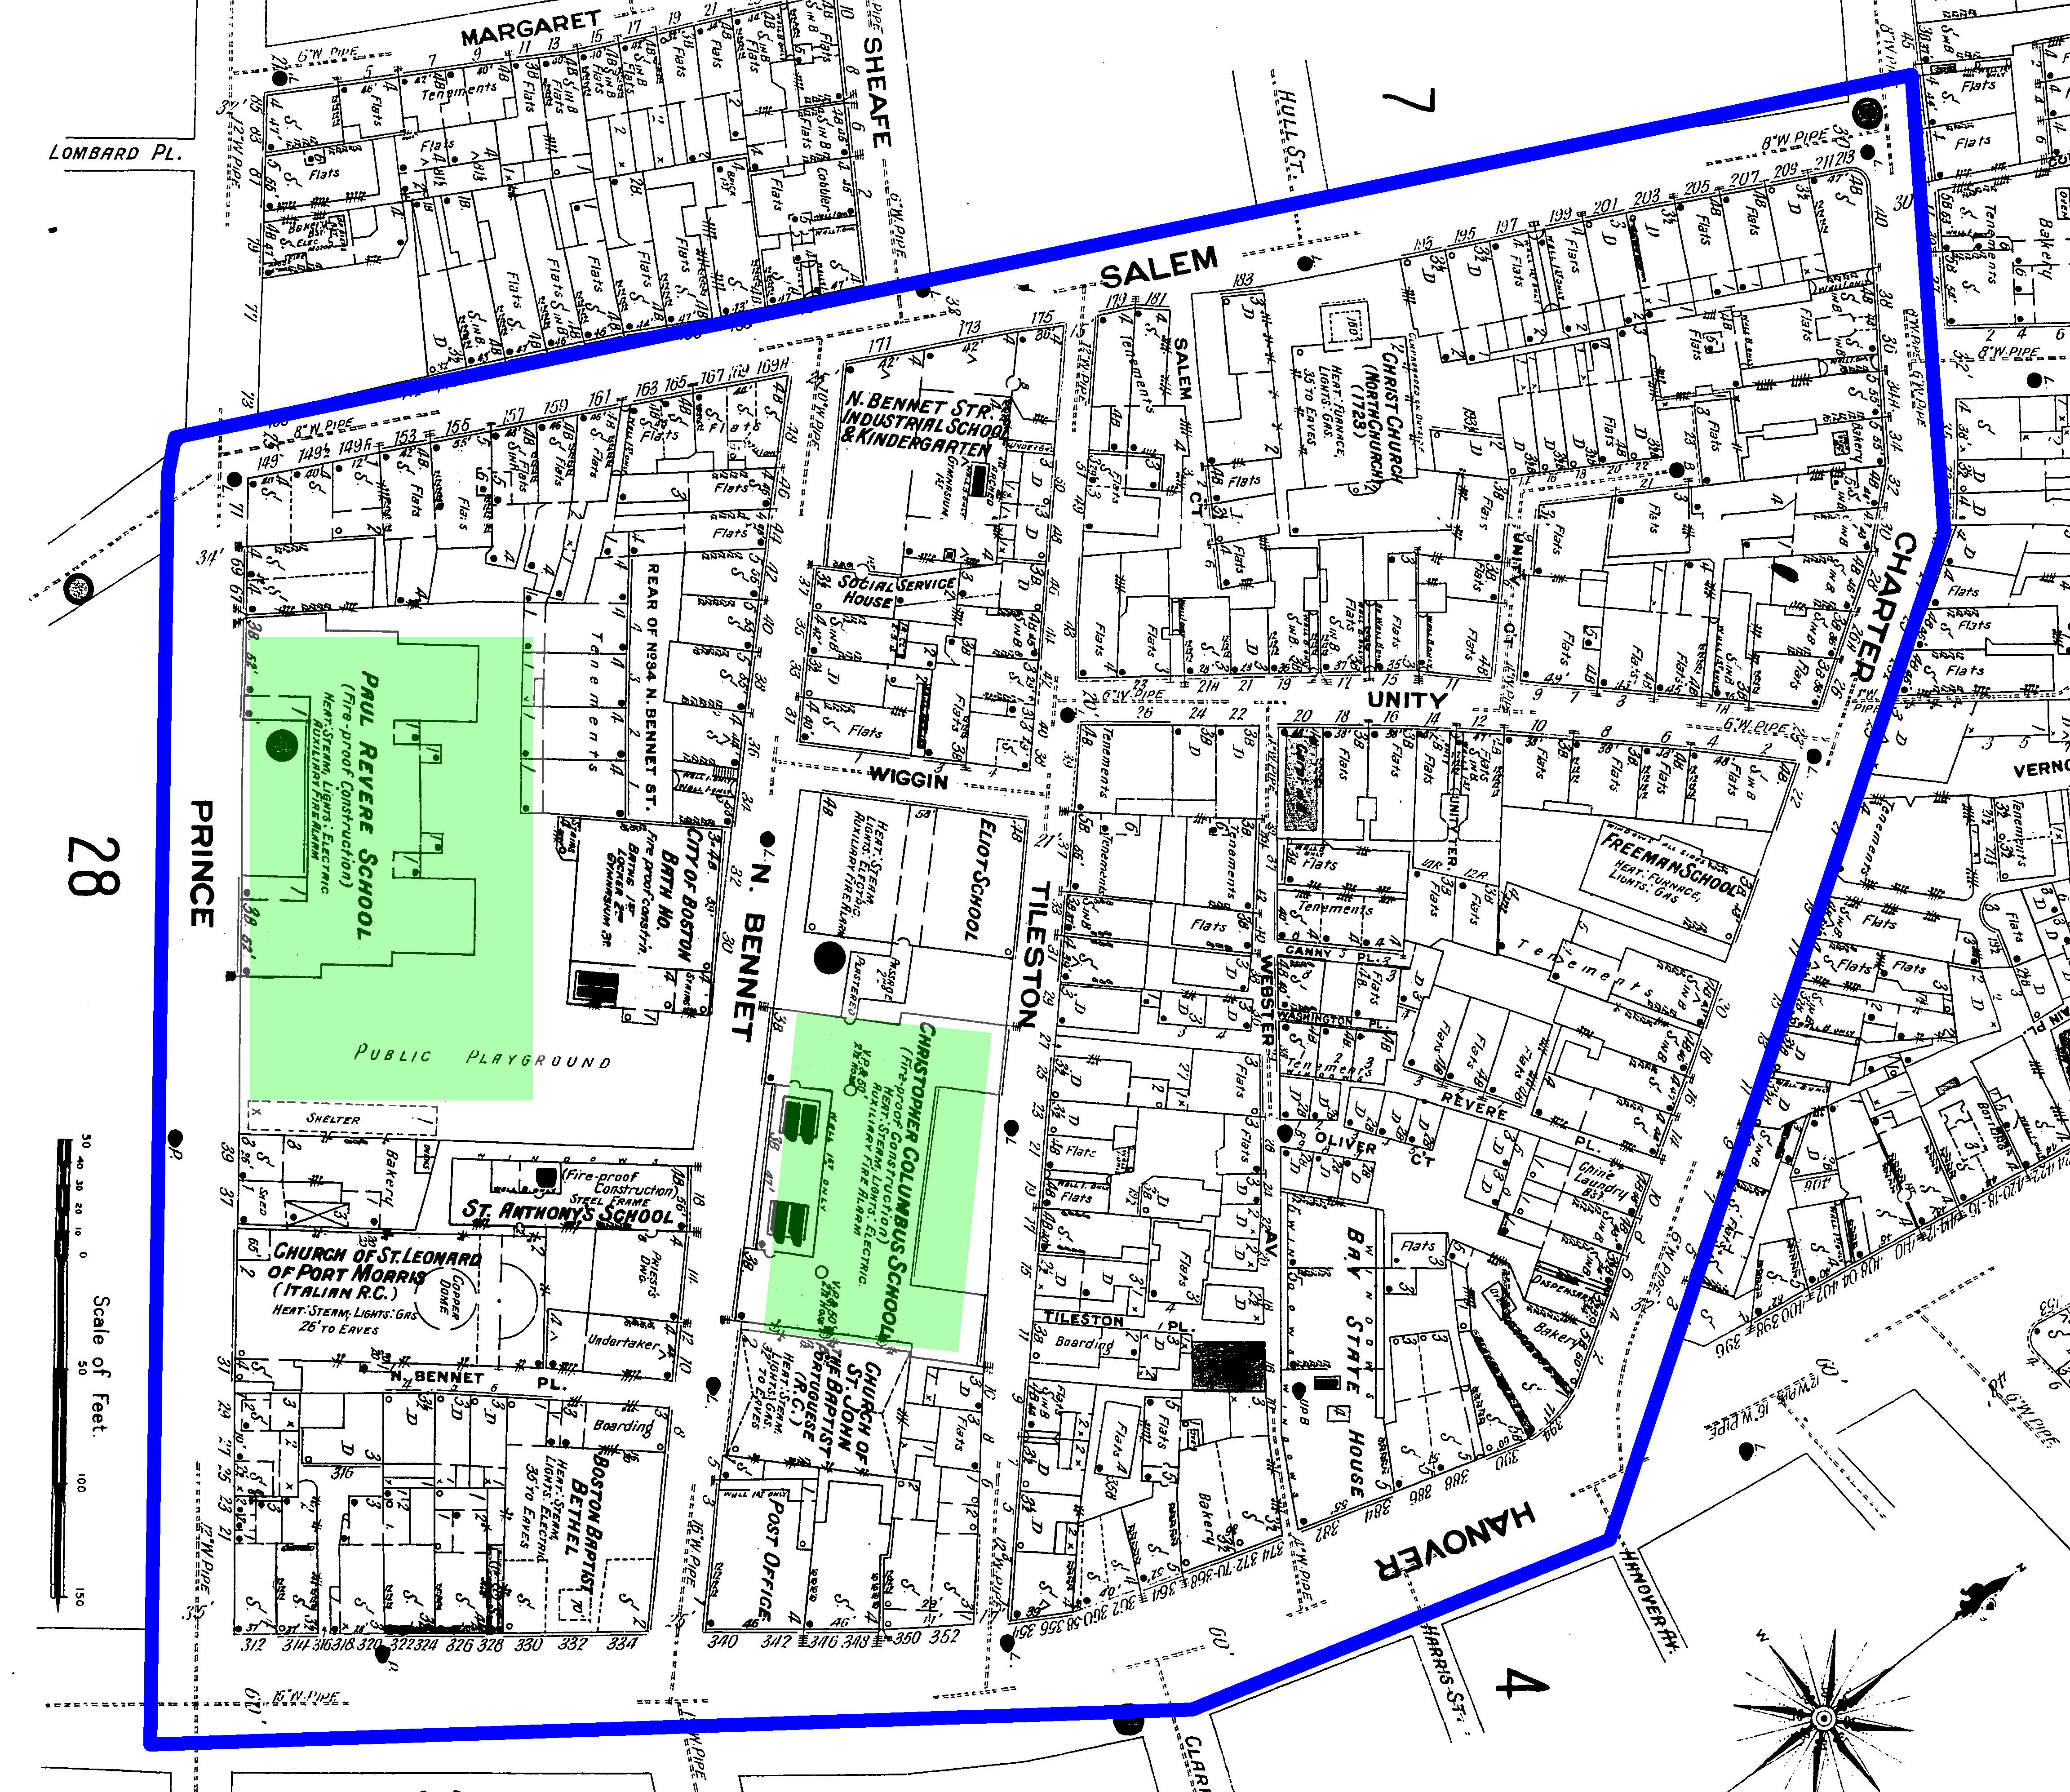 (Click to enlarge)1909 map of North End, the big new schools shown in green.
Sanborn, Daniel Alfred. Insurance Map of Boston. Map. 1909. Digital Sanborn Maps. Web. 15 May 2014.
The map to the right, from 1909, shows a greatly transformed site. Two new very large buildings, the Paul Revere School and the Christopher Columbus School, appear on the map. In the process, most of the tenements in the west half have been removed. The St. Leonardo Church has also grown a bit in size, clearing a small but dense housing area as well. Still, tenement complexes in the east have continued to grow and even more iterations of the word can be found around Webster Avenue, so that the next big change will appear even more drastic.
 (Click to enlarge)1951 map of North End.
Sanborn, Daniel Alfred. Insurance Map of Boston. Map. 1951. Digital Sanborn Maps. Web. 15 May 2014.
During the 1930’s, the construction of the Paul Revere mall takes place. For this massive project, the Webster Avenue and the two whole blocks surrounding it – the blocks containing the most densely packed tenements – get completely destroyed. These changes are quite dramatic indeed: in less than 30 years, my site went from being one of the densest zones of the North End to being one of the zones with the most open space – the difference between the second map to the right, from 1951, and the map from 1895 is simply overwhelming.
With so many tenements torn apart, it is only natural to wonder what happened to all the people living there. Why did the government decide to strike there, and most importantly, how were they able to destroy such a large housing area? Was there friction with the people living there? The timing of all these events is actually just a bit off for them to make sense. Indeed, Warner writes about the land renewal legislation, which basically allowed for such drastic projects to take place by force, and how “Boston, like other American cities, started on the wrong foot, clearing whole neighborhoods. […] Long-time tenants and residents were suddenly displaced for the more affluent and businesses [and] the injustice brought increasing protests” (12), which would make a very good job at describing the phenomena going on here. Unfortunately, the land renewal legislation that Warner refers to does not take place until the 1950’s, so this situation seems to somehow get ahead of time and be representative of problems that would occur in the future. The answer to how these gigantic changes took place before the legislation is thus somewhat of a mystery, although it is fairly clear why the zone was such an easy target for such projects, with it being one of the densest and most undesirably crowded areas of the neighborhood.
Present Day
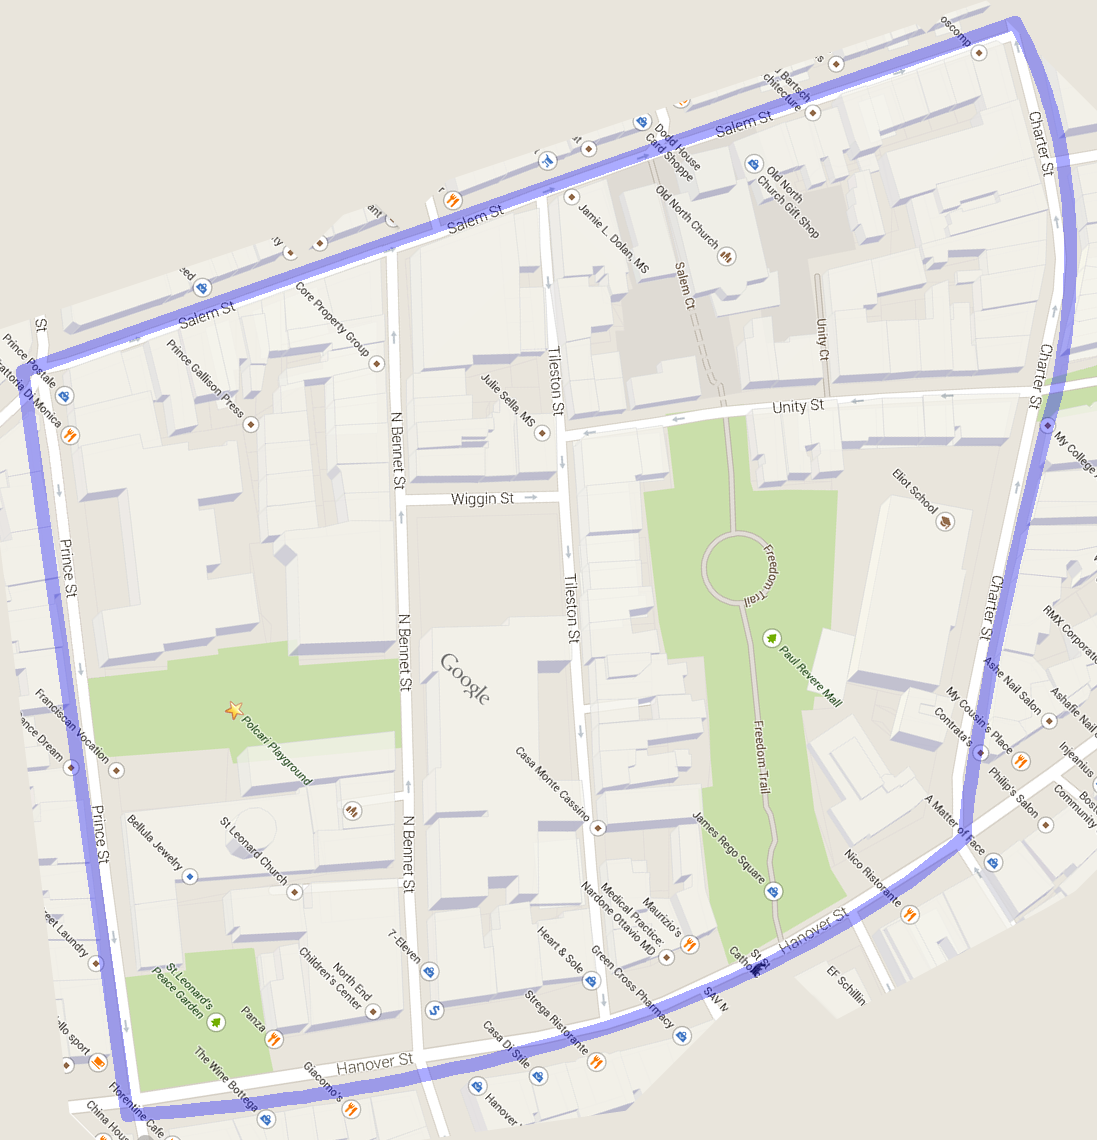 (Click to enlarge) A current date map of Boston.
"Boston, MA." Map. Google Maps. N.p., n.d. Web. 3 Apr 2014.
After these big drastic changes, it is somewhat surprising that the site managed to get through the rest of the century with very little further change. Looking back at the map from 1951 we see that, confusingly enough, both Freeman School and Elliot School were destroyed, and then a new and larger Elliot School was built where Freeman School used to be, and the new Elliot School was the only building in the block not to be destroyed with the construction of the mall. Today, the new Elliot School is the only school that remains in the site. The big Christopher Columbus and Paul Revere schools from before are still present as buildings, but are no longer schools, now serving as multi-family housing complexes for a still increasingly dense population today – a common trend that has accompanied the North End throughout its history. In fact, most of the big institutions that were present before shared the same fate. The St. Leonardo Church has grown yet again to annex the St. Leonardo Peace Garden, taking away most of the remaining small multi-family dwellings in the west half. The remaining Baptist church, on the other hand, has now been transformed into a children’s’ center. The site has retained all of the open areas it had in 1950, including the large open playground that was built with the Paul Revere School, making it remain as one of the zones with the most open areas in the North End.
All in all, there have been many very strong changes that have taken place in my site, as well as more subtle changes and aspects that do not change at all, both of which can be just as important as the big changes. The changes in the churches present, for example, serve to show that foreign influence has always held an important role in the North End; whereas the unchanging streets serve to illustrate the problem of the site being trapped in a certain state because of the dense surroundings not allowing big spatial transformation. The land use distribution, mainly residential and institutional throughout the centuries but tending more towards residential in the recent decades, gives a very clear representation of an ever denser neighborhood for which overpopulation has always been and continues to be an issue. Together, all the changes and no-changes of the site through time help us understand the scenario in which it is found today and the dynamic evolution of it that is going on constantly.
References
Jackson, Kenneth. 1985. Crabgrass Frontier: The Suburbanization of the United States. New York: Oxford University Press.
Warner, Sam. 1999. "A Brief History of Boston." In Mapping Boston, 3-14. Cambridge: MIT press.