A city is like a living, breathing organism. It changes and adapts to any situation it finds itself in, and for centuries these changes have been recorded in the maps, drawings, pictures, and texts created by our ancestors. Although there is no way to truly know what the city was like at every point in history, studying these maps and documents, these records of days long gone, can provide a window into the lives people once led. Maps are far more than just lines demarcating which house was on which street; they tell a story, rich in detail and nuance that can be extracted with a little context. Socioeconomic trends, new inventions in the transportation industry, waves of immigration, geographical changes, and the location of jobs all cause the city to adapt and change. What can be even more interesting, however, is how certain parts of the city endure and remain over time. Why can one block be preserved for centuries, undergoing only minimal changes, while the block immediately next to it gets completely demolished? Why do the changes happen where they do?
My site deals explicitly with this juxtaposition of the constant and the transitory and demonstrates how different factors influence the development of a site over time. What began as a solid line of buildings sandwiched between Bendell’s Cove and Mill Pond is now segmented into three distinct sections. While the outermost sections remain similar to how they were in the early days of Boston, the blocks between Richmond Street and Blackstone Street are vastly different. The introduction of the automobile and subsequent construction of the central artery through Boston completely bisected my site, exchanging shops and buildings for a winding mass of paved roads. Recently that same area has undergone even more change, as the city of Boston began to reclaim the territory of the cars and trucks back for people through the Big Dig project, transforming the area into a green space appropriately titled the Greenway. By studying when and where these changes occurred, and how the relatively constant surrounding blocks were affected, the specific story of my site can be pieced together, along with a picture of how the broader world changed and evolved over time.
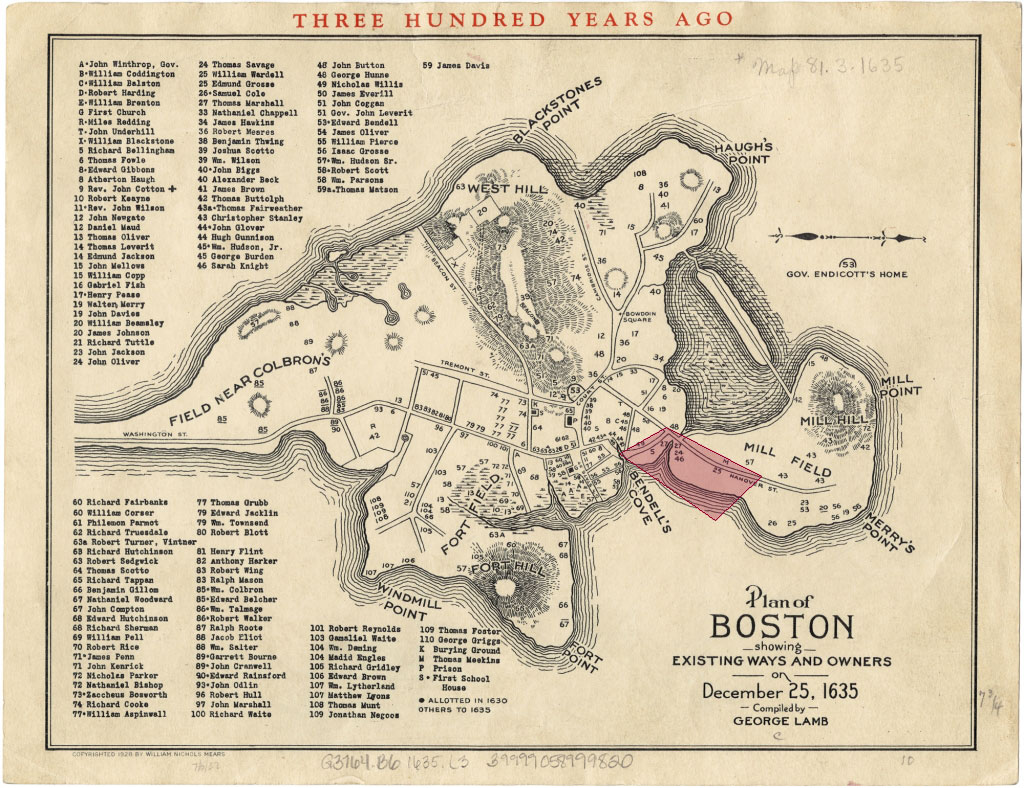 Figure 1. In 1635 my site was mostly underwater, with only Hanover Street and Union Street already in place. The land was mostly undeveloped at this point. Map from Norman B. Levanthal Map Center at the Boston Public Library (1903) http://maps.bpl.org/id/10923. Modified by Author.
The Boston area was first settled by the Puritans in the 1630s. As can be seen in this map from 1635, my site has been around since the early days of Boston, but back then was made up of only a single pair of roads, Union Street and Hanover Street. Hanover Street was originally surrounded by water, and formed the connection between the downtown section of Boston and the Mill Field area, now known as the North End. The waterfront origins of my site are still apparent in certain street names: where the Mill Creek once flowed between the Mill Pond and Bendell’s Cove there is now a street called Creek Square, found in the Union Street block. Due to its ideal location as a bridge between the two parts of Boston, it is likely that Hanover Street was a well-used thoroughfare back in the 1600s, especially as the North End started expanding.
By 1722, part of Mill Pond and part of Bendell’s Cove had been filled in, and my site took the approximate shape and street layout that it has today. There was an enormous increase in the number of buildings and streets in the area between 1635 and 1722, demonstrating just how quickly the population grew. The bodies of water were probably filled in for exactly this reason: to provide more space for an expanding population. By 1740, the population of Boston was 17,000, up from 7,000 in 1690, which made it the largest city of the American colonies. [1]
The population of Boston continued to grow through the nineteenth century, and in the North End in particular this growth was mainly caused by an influx of Irish immigrants. According to Krieger’s Mapping Boston, “by 1850 Boston had 35,000 Irish, [and] by 1860 [it had] 50,000, almost a third of the city's population.” [2] The potato famine in Ireland caused many people to leave their homes in search of a better life in the States, and when they moved to Boston they stuck together, all settling in the same area. The old port-side neighborhoods of the North End became a sort of “nineteenth century immigrant registry”, first with the Irish, until the 1880s, and then with the Jewish and Italian immigrants in later years. [3]
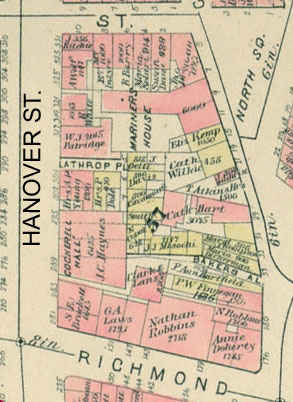 Figure 2. A close up view of one of the blocks of my site from 1883. Notice how there are only a few distinctly Irish names showing up, such as Annie Doherty in the bottom right corner. Also notice that at this point the Paul Revere House (yellow with “438” on it) is simply a privately owned home. Map from Atlas of the City of Boston, from Actual Surveys and Official Records; City Proper, Volume 1 (G.W. Bromley & Co., 1883) MIT Library Dome Collection, http://hdl.handle.net/1721.3/48709. Modified by Author.
 However, when looking at a map of landowners from the late 1800s it is not immediately clear that the area was heavily populated with Irish immigrants. There are only a few Irish surnames, such as Doherty and Finnegan, interspersed between an overwhelming majority of English names like Robbins, Davis, and Leeds [4]. This lack of distinctive ethnic names is due to a lag effect, in which it takes many years for new immigrant groups to build up enough wealth to become landowners instead of simply renting space in a particular area. By 1902 the North End began to be populated with other names like Silverman, Scigliano, and Tossinari, hinting at the Jewish and Italian groups that had also settled there. [5] The Italian influence can also be seen in the name change of a hotel between the 1895 and 1909 Sanborn maps of my site: what used to be “Hotel Ludwig” became the very Italian “Hotel Venice”.
The rise and fall of the tenements can also attest to the changing population and influx of immigrants between 1895 and 1929. These cheap living quarters provided housing for countless immigrants and the poor during the early 1900s. Looking specifically at the North End section of my site, in the area bounded by Cross Street, Hanover Street, Prince Street, and North Street, the types of living spaces available changed drastically over the course of 35 years, as can be seen in the maps below.
 Figure 3. Maps showing how the northern section of my site changed between 1895 and 1929. Notice in particular how the area seems to become less dense over time, as the land usage changes and plot sizes increase. The legend uses the standardized international land use colors. Maps from Sanborn Fire Insurance Maps from 1895, 1909, and 1929. Modified by Author.
The 1895 Sanborn map shows that there was an abundance of single family dwellings at that time, approximately equal to the number of stores in the area. These houses were dispersed amongst the Prince Street/ Richmond Street block (northern block) and the Richmond Street/Cross Street block (southern block). There were a few flats near Richmond Street in the northern block, some which seem to have been above stores, most likely run and owned by the family that lived there. In the southern block, the tenements were all congregated in the middle, and are depicted as long, fairly large buildings. Their location in the center of the block, with no immediate street access, was most likely due to the fact that since the buildings didn’t incorporate stores of any kind there was no need for easy access by the public. The less than ideal location also probably lowered the price, which would be attractive to poor immigrant families. By 1909, many of these buildings had changed. Some of the dwellings along Prince Street had been repurposed into stores, and more tenements and flats appeared in the northern block, in some cases taking the place of previously existing stores or dwellings. In the southern block many of the larger tenement buildings were broken into multiple, smaller flats, and the large group of single family dwellings below Mechanic’s Street gave way to a clothing factory/cracker bakery and more flats.
This sudden increase in flats and tenements and decrease in single family dwellings suggests a shift in the population. It is very probable than many of the older, wealthier families had left the city for a more private life in the suburbs or other parts of the city, where urban overcrowding and filth were not an issue. The initial arrival of immigrants also began a chain reaction, causing even more of the old families to move away. As is mentioned in Jackson’s book Crabgrass Frontier, “The changing ethnic composition of the urban population also increased middle-class antipathy to the older neighborhoods, as Poles, Italians, Russians, and assorted eastern and southern Europeans, most of them Jews or Catholics, poured into the industrialized areas after 1880.” [6] This trend was seen in cities like Chicago and New York as well, suggesting that the influx of immigrants was a widespread phenomenon, not limited to the North End of Boston. [7] In the 1909 map in figure 3, a few of the dwellings at the top of the southern block are even listed as “old & vacant”, reinforcing the idea of this migration, and suggesting that the new residents of the area were not wealthy enough to purchase an entire house for themselves. By 1929, there were very few buildings specifically dedicated to housing, although it is likely that there were still apartments above all the stores.
The stores and factories in the area also hint at the immigrant population. In the southern block in 1909 there were many factories which would have been able to provide low wage jobs for immigrant populations. In that small area alone, there was a mattress factory, a cigar factory, a clothing factory, a cracker bakery, and numerous furniture stores. In the northern block there are no factories, but there is a Mariner’s House and the Boston Seaman’s Friend Society building. The presence of both of those buildings demonstrates the proximity of the North End to a port, which would be the point of entry for new immigrants.
The mass exodus of wealthy landowners from the crowded city center was enabled by one very important thing- the rise of the automobile and the streetcar suburb. This fundamental shift in the way people thought about cities and transportation brought significant modifications to the structure of the city itself. As can be seen in the maps in Figure 3, a huge transition happened between the years 1909 and 1929: more than half of the southern block was demolished to make room for the Sumner Tunnel. The construction of the Sumner Tunnel by Boston’s popular Mayor Curley was only the first step in the long series of changes that occurred on my site due to the rise of the automobile. [8]
But why was the tunnel built where it was? How could an entire block be destroyed so quickly? With a closer look at what buildings used to be there, it becomes more reasonable for the tunnel to have been constructed in that location. According to the 1909 Sanborn map, most of the area was filled with warehouses, factories, and shops. These types of buildings may have been easier for the government to acquire, as they wouldn’t directly displace any people from their homes.
This destruction of factories and warehouses also represents a shift in the character of the North End in general. In the 1850s the abundance of cheap labor from the tenements in conjunction with various types of factories (cigar, clothing, furniture, and mattress factories, in this case) transformed Boston into the region’s largest manufacturing center. [9] The abundance of nearby jobs was probably another cause for the influx of immigrants. After the construction of the Sumner Tunnel, the area needed less housing since the work was no longer there to draw immigrants and the poor to the area, which can explain why there is barely any housing left in the 1929 map.
Over the course of the next 50 years automobiles became even more prevalent. This abundance of cars eventually led to the Interstate Highway act, which became law in 1956. According to Crabgrass Frontier, “this law provided for a 41,000-mile (eventually expanded to a 42,500-mile) system, with the federal government paying 90 percent of the cost.” [10] For Boston, this meant the construction of the elevated Central Artery for Interstate 93, an installation that completely bisected my site and eliminated an entire block of shops and buildings. The full effect of the change can be seen in the maps below.
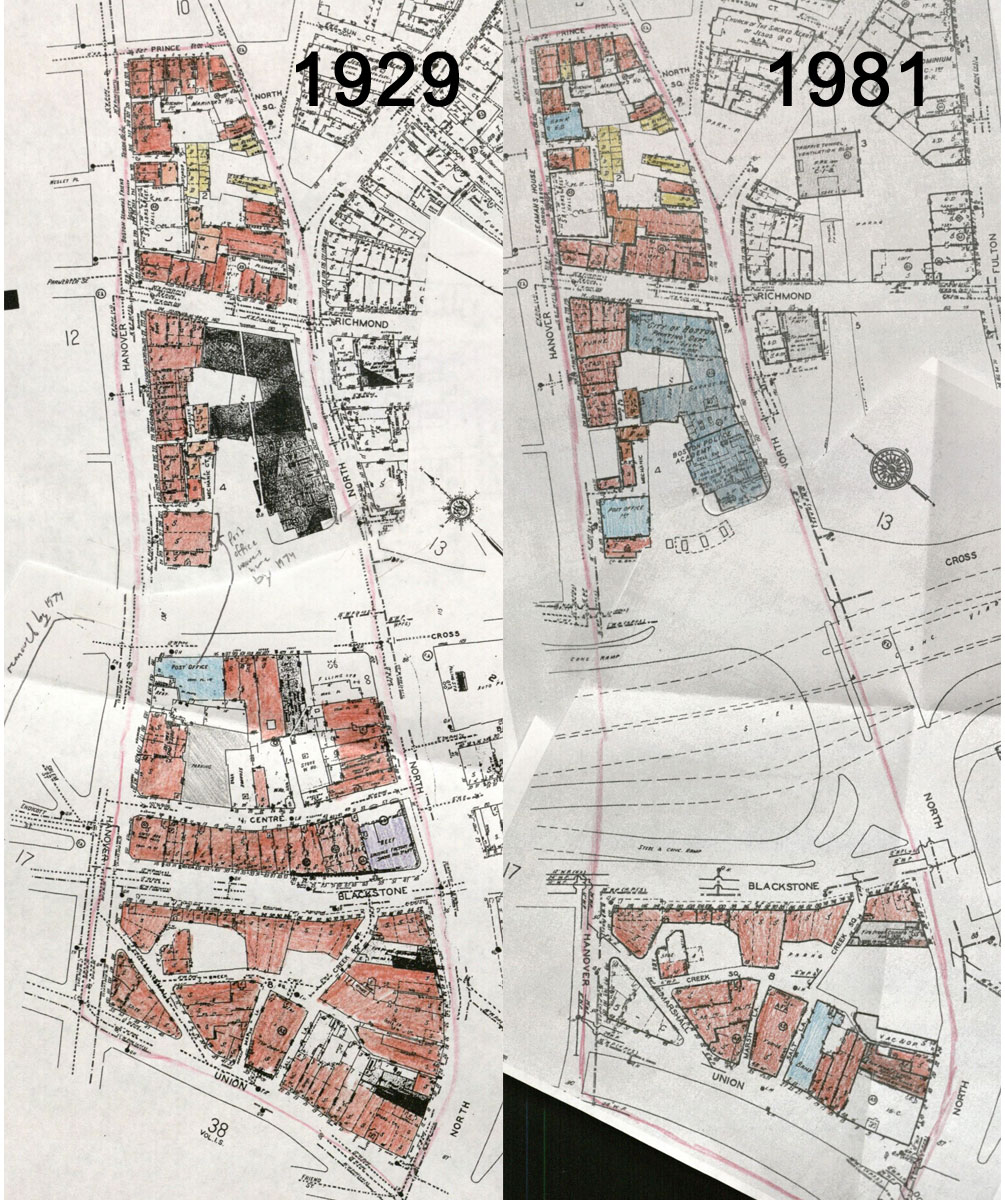 Figure 4. Maps showing the changes that occurred due to the Interstate Highway Act. While most of the services in the block that was demolished were simply lost, it is of note that the post office simply moved to the space at the bottom left of the Sumner Tunnel entrance. There is still a post office there today. Maps from Sanborn Fire Insurance Maps from 1929 and 1981. Modified by Author.
This change to the landscape, this intrusion of on-ramps and concrete where stores once stood, shows America’s obsession with cars and highways, and the lack of foresight for the consequences of a city made of pavement. My once united site became divided, as the gap that began with the construction of the Sumner Tunnel grew even wider with the installation of the elevated interstate highway. Damage to urban neighborhoods was not isolated to a few occurrences in Boston, either. Clay McShane, a specialist in United States urban and social history, was quoted in Crabgrass Frontier as saying, “Thus, in their headlong search for modernity through mobility, American urbanites made a decision to destroy the living environments of nineteenth century neighborhoods by converting their gathering places into traffic jams, their playgrounds into motorways, and their shopping places into elongated parking lots. These paving decisions effectively made obsolete many of America’s older neighborhoods.” [11] While the North End was by no means obsolete, the meaning McShane was hoping to convey rings true with my site. The American obsession with highways went too far, and my site suffered the consequences.
In the late twentieth century, the Central Artery/Tunnel Project, colloquially known as the “Big Dig”, began working to undo the damage that the Interstate Highway Act had inflicted on Boston’s neighborhoods. The six lane elevated highway was changed into a system of tunnels, allowing people to reclaim the land that had once been under layers of concrete ramps. This reclamation involved creating a line of parks where the highway once stood, and is known as the Greenway. Currently, my site looks something like this:
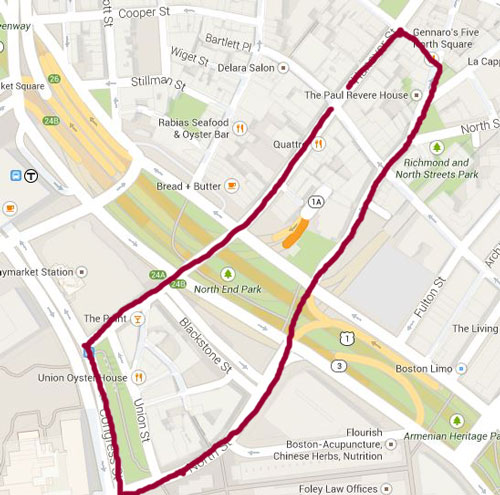 Figure 5. My site today is segmented into three parts, but unlike in the days of the elevated Central Artery, now it is actually possible to walk from one end to the other. Although the two ends of my site are relatively similar to how they were in the past, my site has gone through many changes over the years. Imagery ©2014 Google, Sanborn. Modified by the author.
My site includes more green space now than has been there since the late 1600s, before the area was fully developed. The streets are still lined with stores, many of them the same buildings that have stood there for centuries. Although some of the functions may have changed, there are certain cases where a building has retained its original function throughout the years. The Union Street block in particular, which I did not touch on much in this analysis, remained very consistent over time, with only minimal changes such as the merging of shops or the construction of a hotel. The Union Oyster House has existed in its current location with its current purpose since the 1800s. This is not true of my other landmark, the Paul Revere House in the North End. In the 1895 Sanborn map, the house was marked as a store, and tenements crowded the yard behind it. While the tenements still existed in the 1909 map, the building had been relabeled as “Paul Revere House (Historical)”, showing that an effort had been made to recognize the house as a historical landmark. By 1929 all of the tenements were gone, and the Paul Revere House had the yard around it that it still has today.
Maps of my site tell the story of how immigration and transportation can impact and change the character of a city over time. Although the North End did not go through any massive upheavals, the adjustments to housing locations and the changes from single family dwellings to flats and tenement houses tell a story of shifting populations and the differing needs of different economic classes. As the population grew, so did the job opportunities, with factories and stores becoming abundant in the early twentieth century. The advent of the automobile brought about far more dramatic changes to my site, causing large sections in the middle of it to be completely demolished in favor of concrete roads. However, through urban revitalization efforts, these roads were eventually relocated underground, leaving room for green space on top. While the Greenway is technically the newest part of my site, especially when contrasted with the century old buildings sandwiching it on both ends, it also is a reminder of the wilderness of old Mill Field from the 1600s, before the site was first developed. The streak of green now running through the city of Boston shows how cyclical and layered life can be, and makes me wonder, where are we heading next?
Notes
1. Sam B. Warner Jr., Mapping Boston (Cambridge Massachusetts: MIT Press, 1962), 6.
2. Ibid., 8.
3. Ibid.
4. Map from Atlas of the City of Boston, from Actual Surveys and Official Records; City Proper, Volume 1 (G.W. Bromley & Co., 1883) MIT Library Dome Collection, http://hdl.handle.net/1721.3/48709.
5. Map from Atlas of the City of Boston, Boston Proper and Back Bay, from Actual Surveys and Official Plans (G.W. Bromley & Co., 1902) MIT Library Dome Collection, http://hdl.handle.net/1721.3/82434
6. Kenneth T. Jackson, Crabgrass Frontier: The Suburbanization of the United States (New York: Oxford UP, 1985), 70.
7. Ibid.
8. Warner, Mapping Boston, 10.
9. Ibid., 8.
10. Jackson, Crabgrass Frontier, 249.
11. Ibid., 168.
Bibliography
Jackson, Kenneth T. Crabgrass Frontier: The Suburbanization of the United States. New York: Oxford UP, 1985.
Warner, Sam B. Jr. Mapping Boston. Cambridge Massachusetts: MIT Press, 1962.