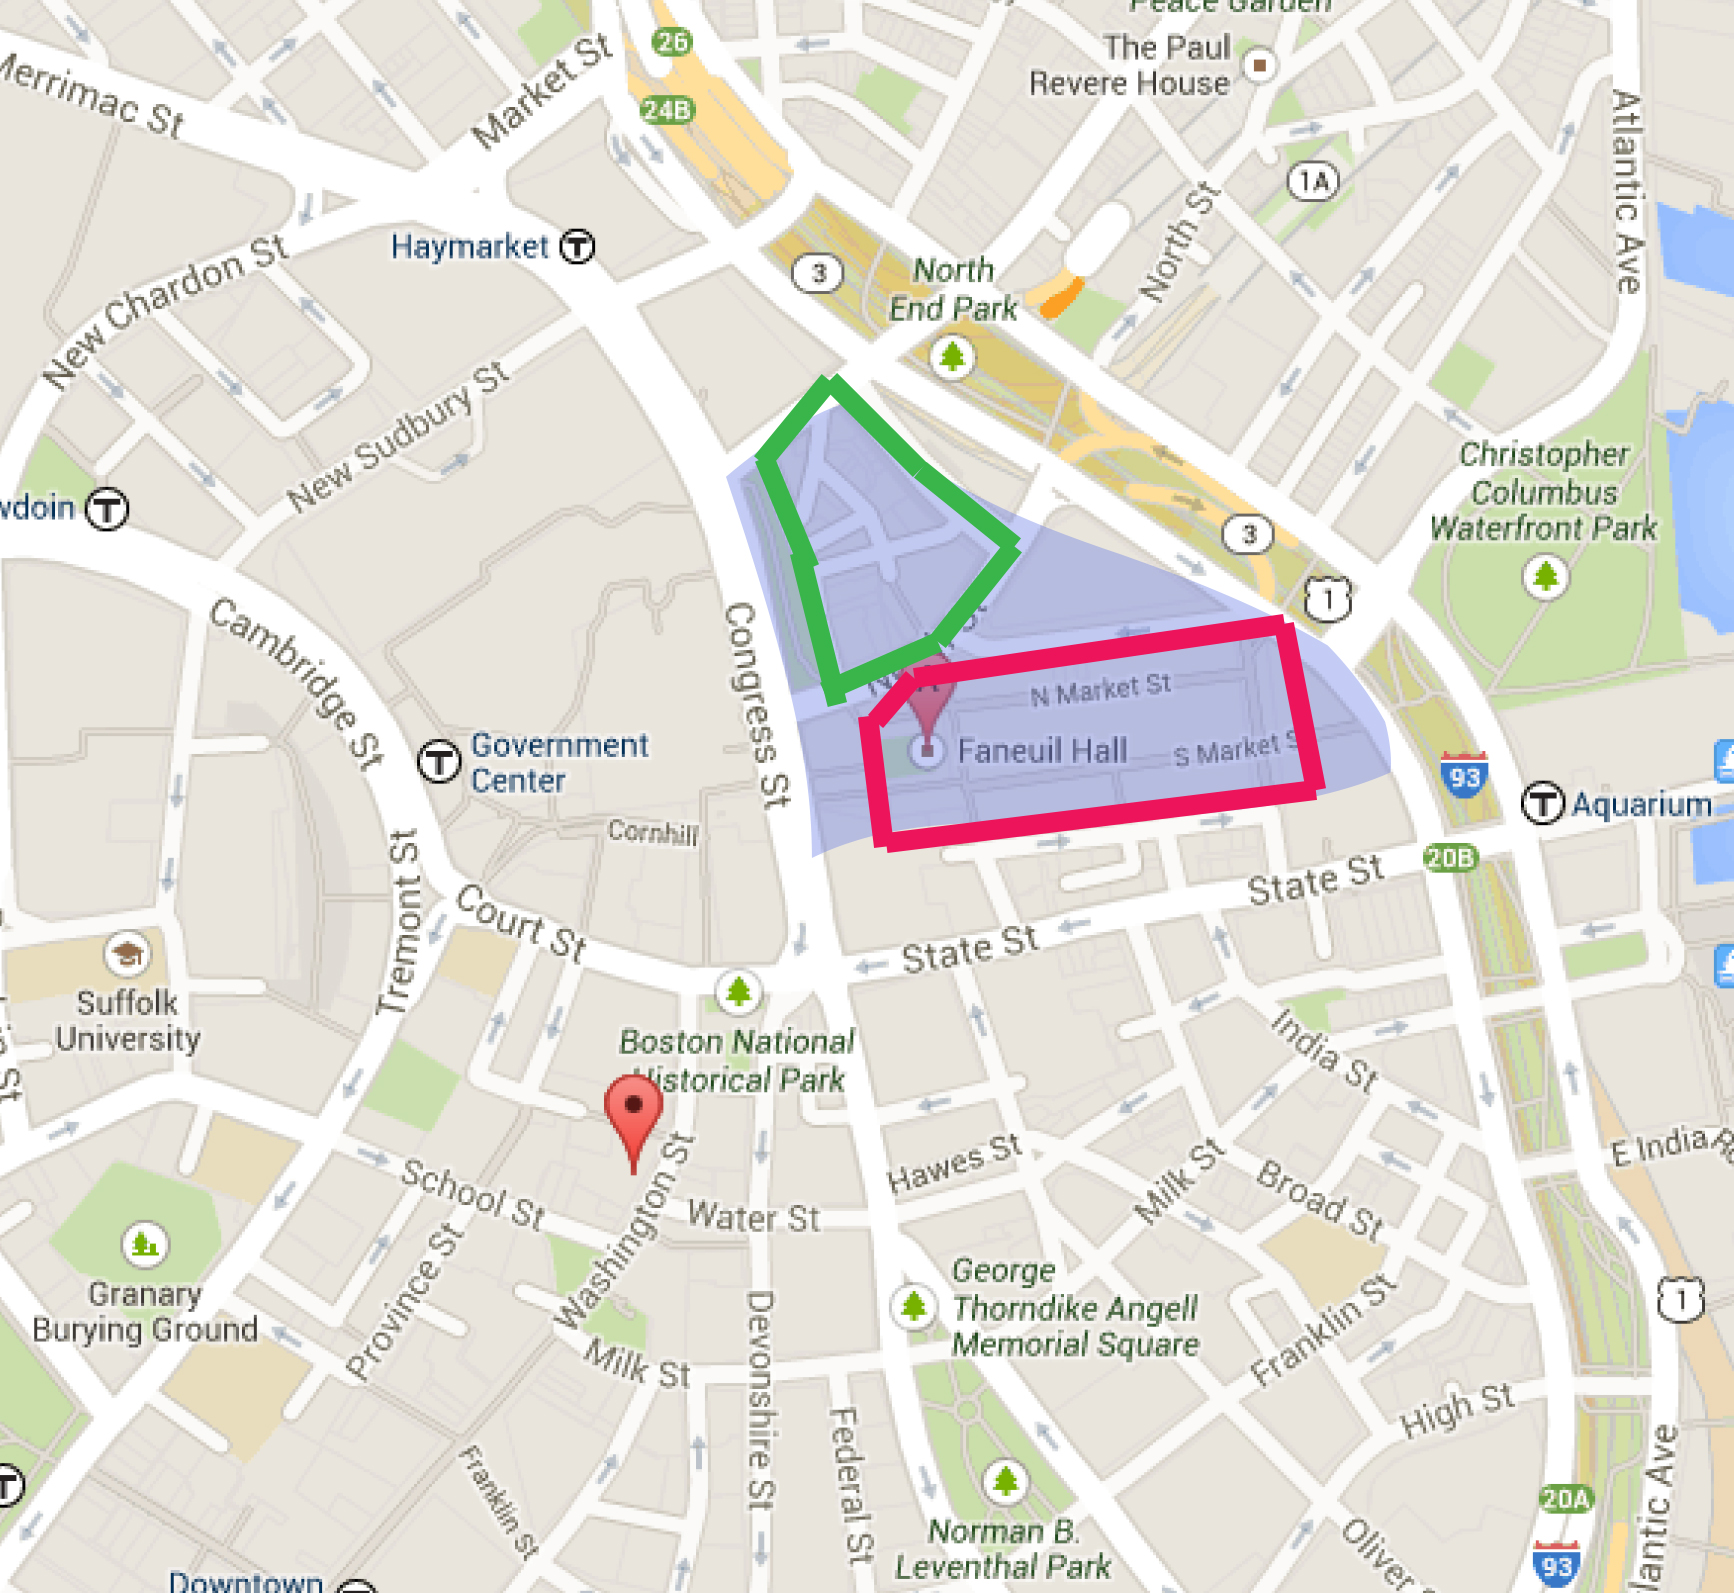
This site, given its historical significance and resultant preservation of much of the original structures and street lines, has not undergone the kind of drastic changes that some areas of Boston have. After the major buildings and streets of the site were laid down, the physical shape of the site deviated very little over time. Beyond the 1826 completion of Quincy Market, the changes in this site--the Blackstone Block and Faneuil Hall Marketplace--are primarily in the subtle shifts in land use, property ownership, and the 1970s renovation.
Before any of the present-day site's landmark buildings were erected, however, it was partially underwater. Below is a section of a 1676 map of Boston proper created in 1920:
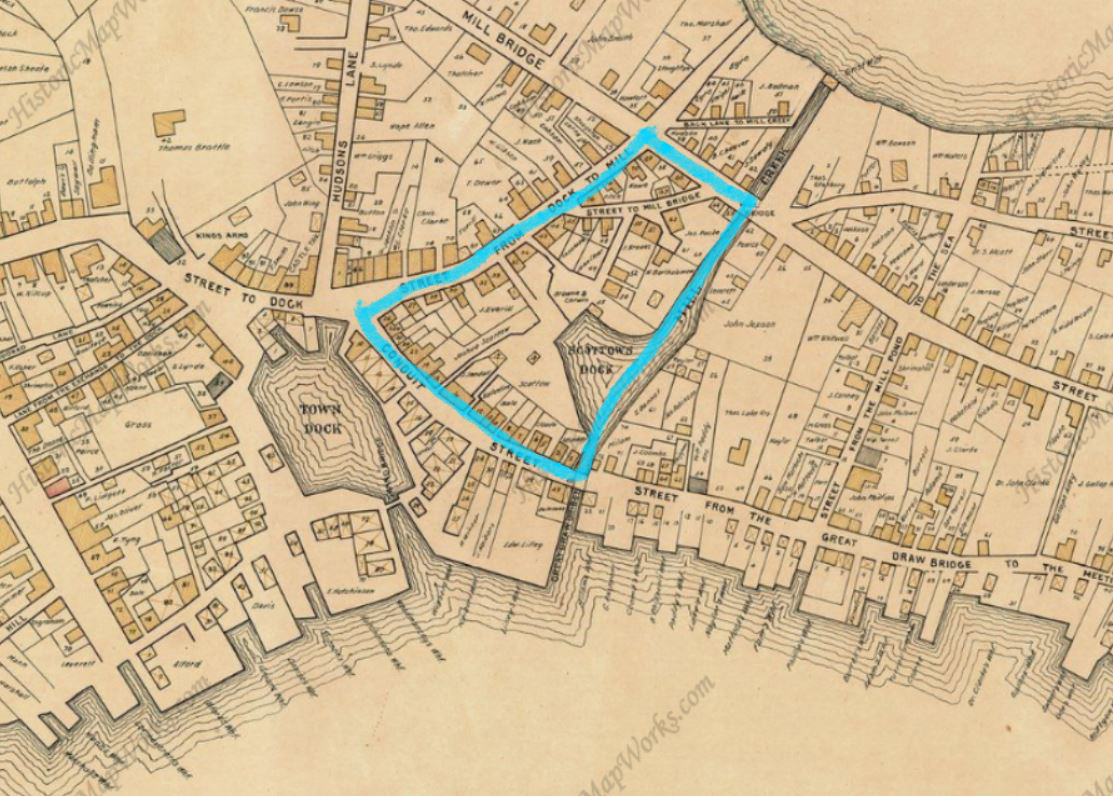
Notice the area where the Faneuil Hall Marketplace stands today--it was once the waterfront along the town dock. The Blackstone Block, too, contains a dock, whose waterway runs up to Mill Pond (a small portion of the pond's shoreline can be seen in the image). In terms of land use, the structures within and around Blackstone appear to be mixed-use between residential (i.e. any of the structures with a single owner), storage (i.e. the stables that line the Town Dock), and commercial (i.e. the other structures around the docks, which are likely small shops/supply stores), with claimed properties labeled with the owner's name.
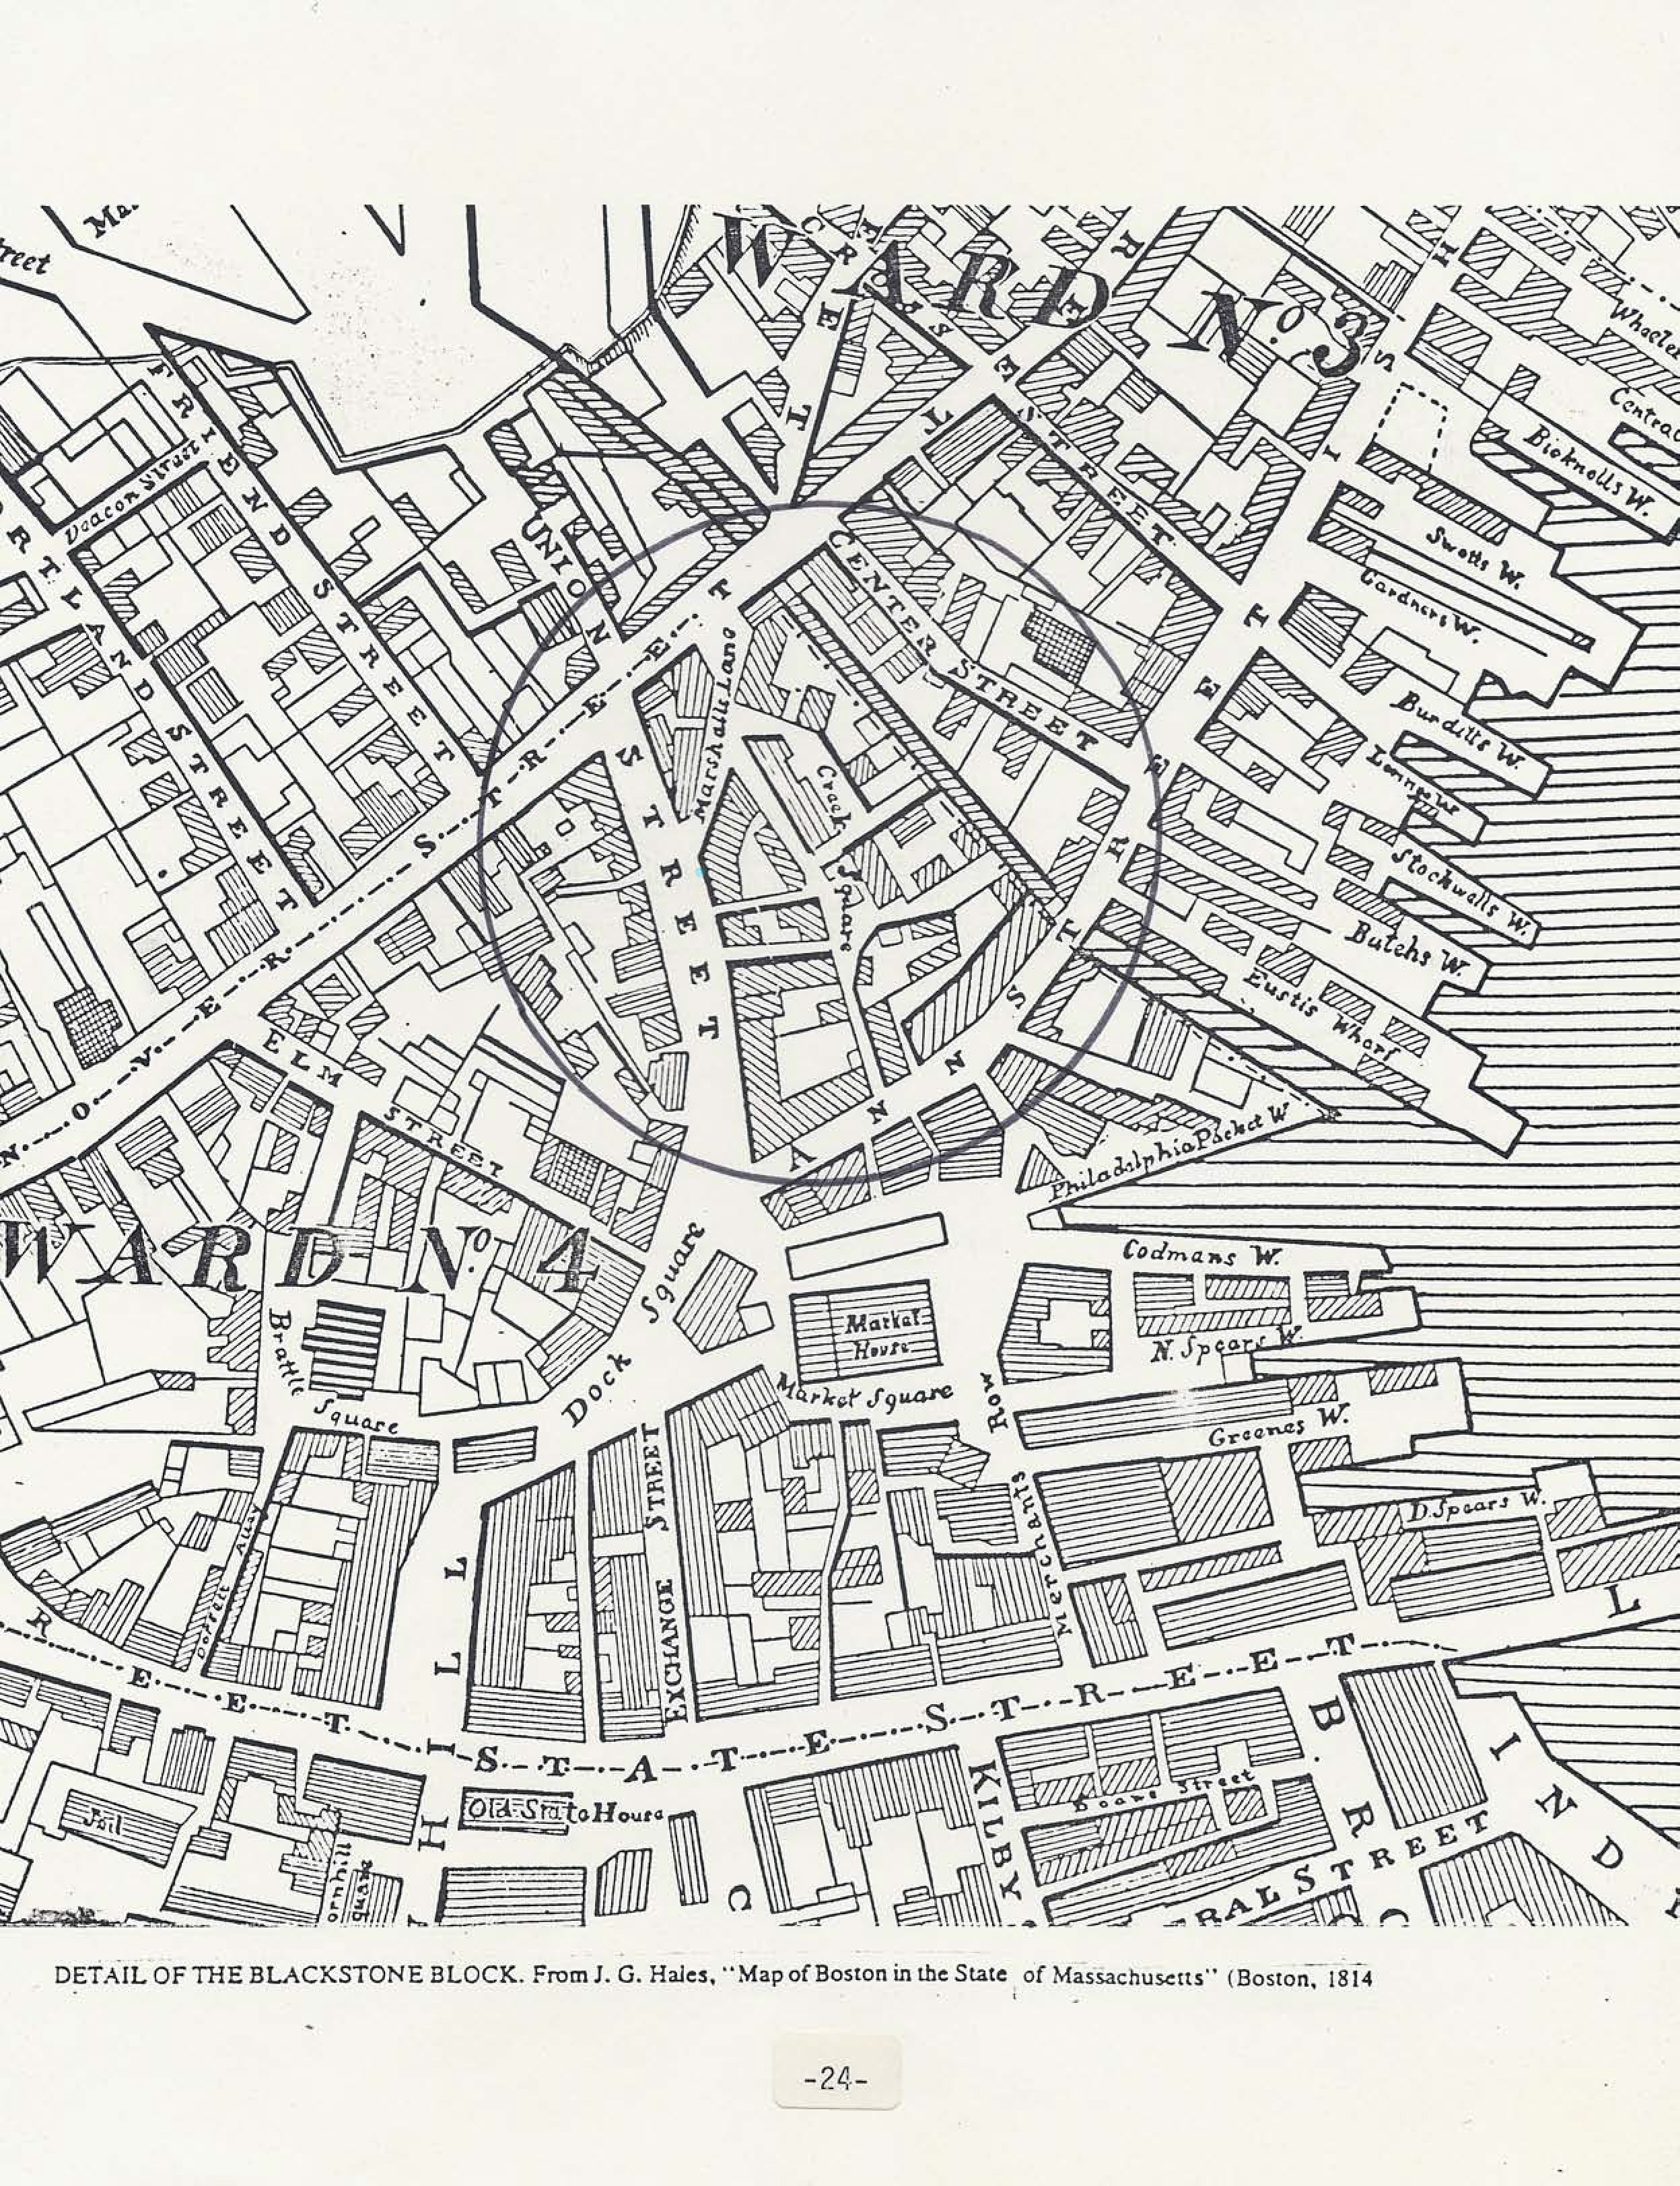
Over a century later, this section of an 1814 map of the site shows the area's development up until just before the 1826 completion of Faneuil Hall Marketplace/Quincy Market. Mill Pond had been fully filled in by this point, and the wharfs lining the waterfront had clearly been extended much further outward into the harbor, including Long Wharf. Interestingly, one of the clearest developmental patterns between these two maps is found in the naming of the streets. Feature names found in the 1814 map (but not in the 1676 map) like Market Square, Merchants Row, and Exchange Street reveal the "fleshing out" of this area as a center of market activity; while the site had already been an area of trade and commerce much earlier than 1814 because of the presence of the Town Dock and its location at the waterfront (Boston Landmarks Commission 1983, 19), the street names reveal the intentional allocation of this area as commercial.
A second trend in street names is the series of names that reference the natural or manmade landmark that had previously occupied the site of the street. Examples visible between the maps are "Dock Square", which sits on the former Town Dock and "Creek Square", which lies along the filled-in Boston Dock; not shown on the 1814 map is Marsh Lane--which was named sometime between 1648 and 1676 (Boston Landmarks Commission 1983, 21)--in the Blackstone Block, likely another reference to the fact that this area was previously partially submerged.
Within the same era as the Hales map is another Clough map, from 1798.
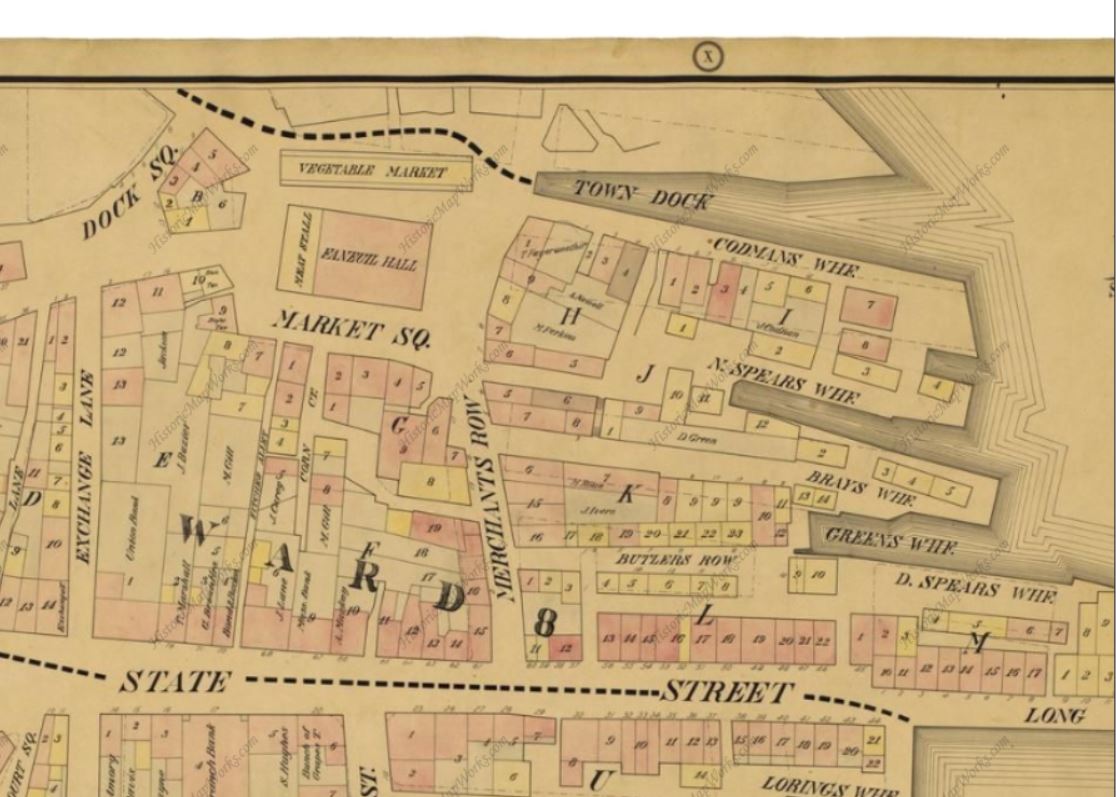
With the higher level of detail this Clough map affords the viewer, more evidence of the heavily commerce-based land use of this site can be seen. Features like the vegetable market just north of Faneuil Hall and the meat stall at the front of the Hall are visible, and though there are a considerable number of what appears to be residential properties, it is not unreasonable to suppose that most of such residences belong to the market's regular merchants. Furthermore, a "Town Dock" is still extant in the form of a small inlet above Market Square--a feature of the site that disappears within the next 50 years.
Looking half a century forward to the index of an 1867 Sanborn Fire Insurance map, it is immediately clear that the trend of outward expansion of the waterfront had continued steadily over the five decades between the previous map and this one.
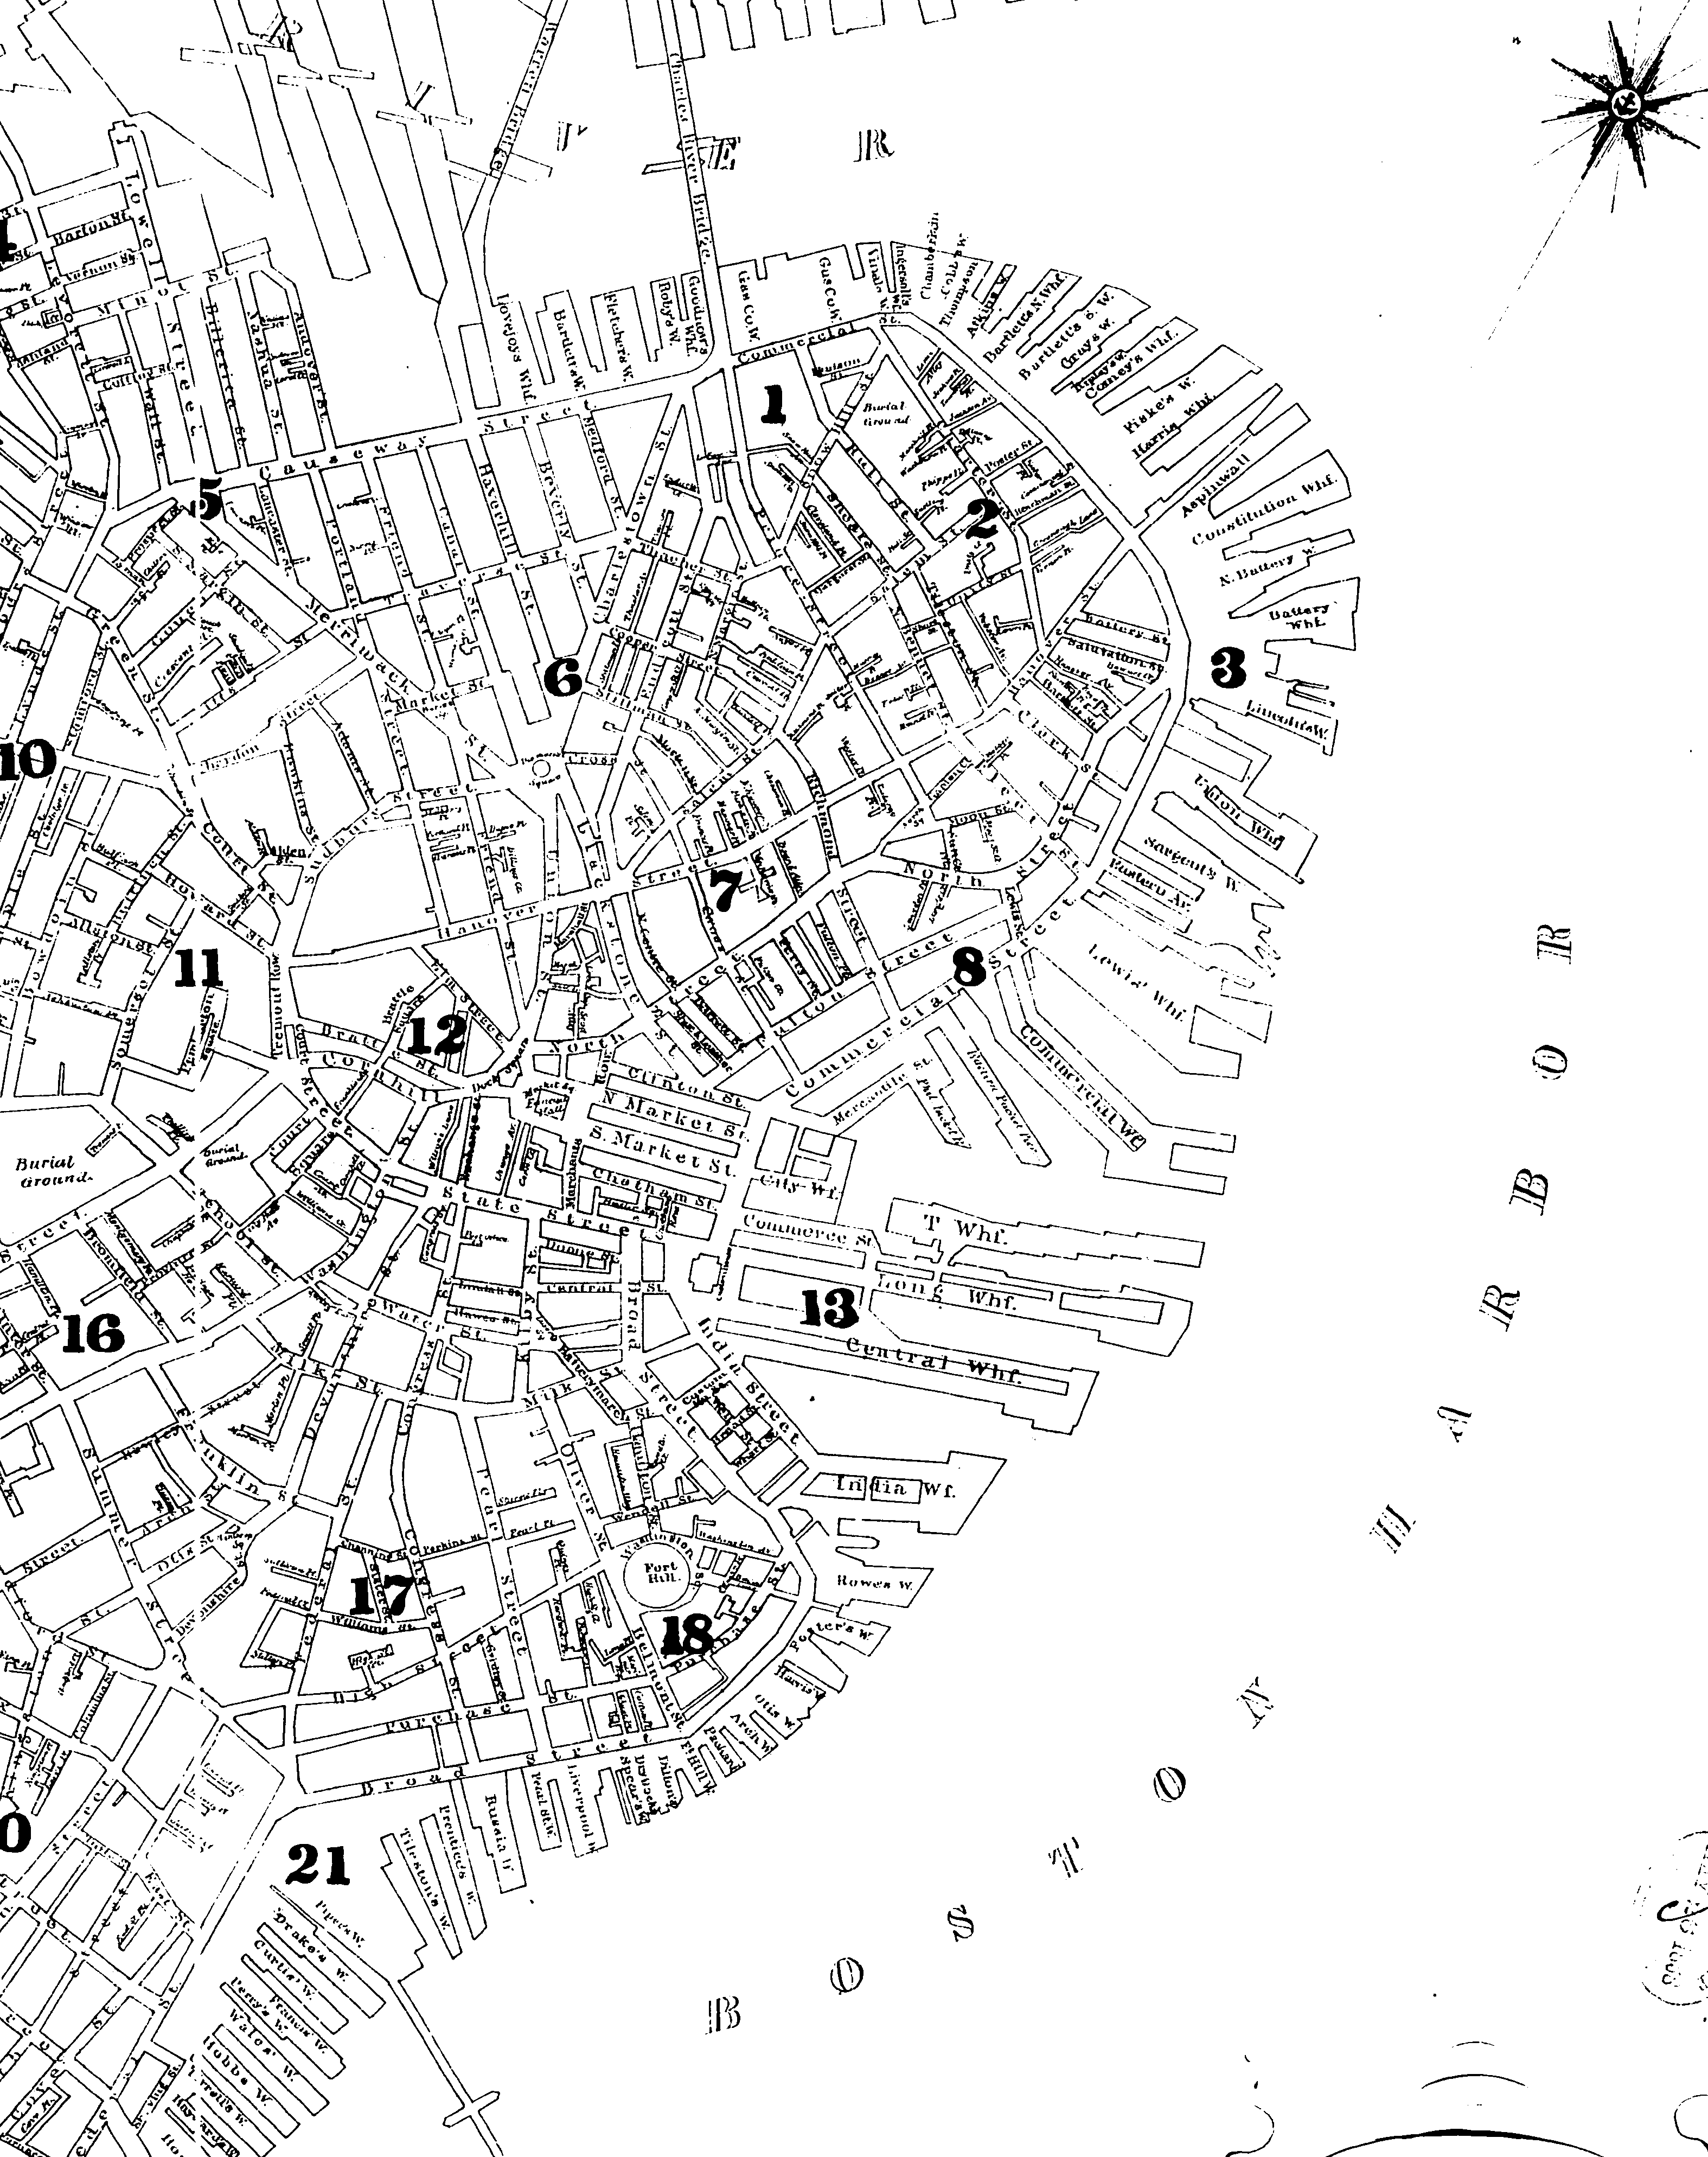
The site, located between sections 12 and 7 on the map, now boasts the completed Quincy Market-Faneuil Hall complex, which sits just behind City Wharf. The complex can clearly still be classified as "waterfront property"--but it is here, with the wharf separating the marketplace from immediate contact with the water, that the first signs of a shift away from solely sea-dependent industries in Boston's commercial interests can be seen. A possible explanation lies in the tremendous advances in technology that characterized this time period (America's Industrial Revolution); one of these advances was the rapid development of the railroad in the 1830s and 40s. Railroads connected peoples from across the country with a speed previously unheard of--transnational commercial interactions were now entirely possible and, in many cases, profitable. As Boston began to import and export goods from all over the country, the commercial focus of the city (like many other northeastern cities during this era) began to move away from being disproportionately sea/agriculture-based, and toward factory-based production. Kenneth Jackson (1985), in his book Crabgrass Frontier: The Suburbanization of the United States, describes how Boston's "metropolitan population swelled in the 1830s and 1840s... (36)", and that this "enormous growth to metropolitan size was accompanied by rapid population growth on the periphery...[and] by an absolute loss of population at the center...(35)". In the context of this site, it could be postulated that the combined store-plus-residence land use that appears to be the case on the 1798 Clough map declined as commercial interests moved away from location-based industries (like fishing and farming) and toward goods-based industries (like factories and shops); with goods-based industries, business owners did not necessarily have to live near the marketplace, and as rail lines and other modes of rapid transit allowed merchants to move away from the dusty, smoky city center, residential land use slowly disappeared, and the site became almost entirely devoted to commercial purposes.
The corresponding plate for this site from the 1867 Sanborn map indicates as much. Sparse few of the property spaces are marked with a "D" for "dwelling", and the spaces that do have an identified owner or purpose are factories and markets.
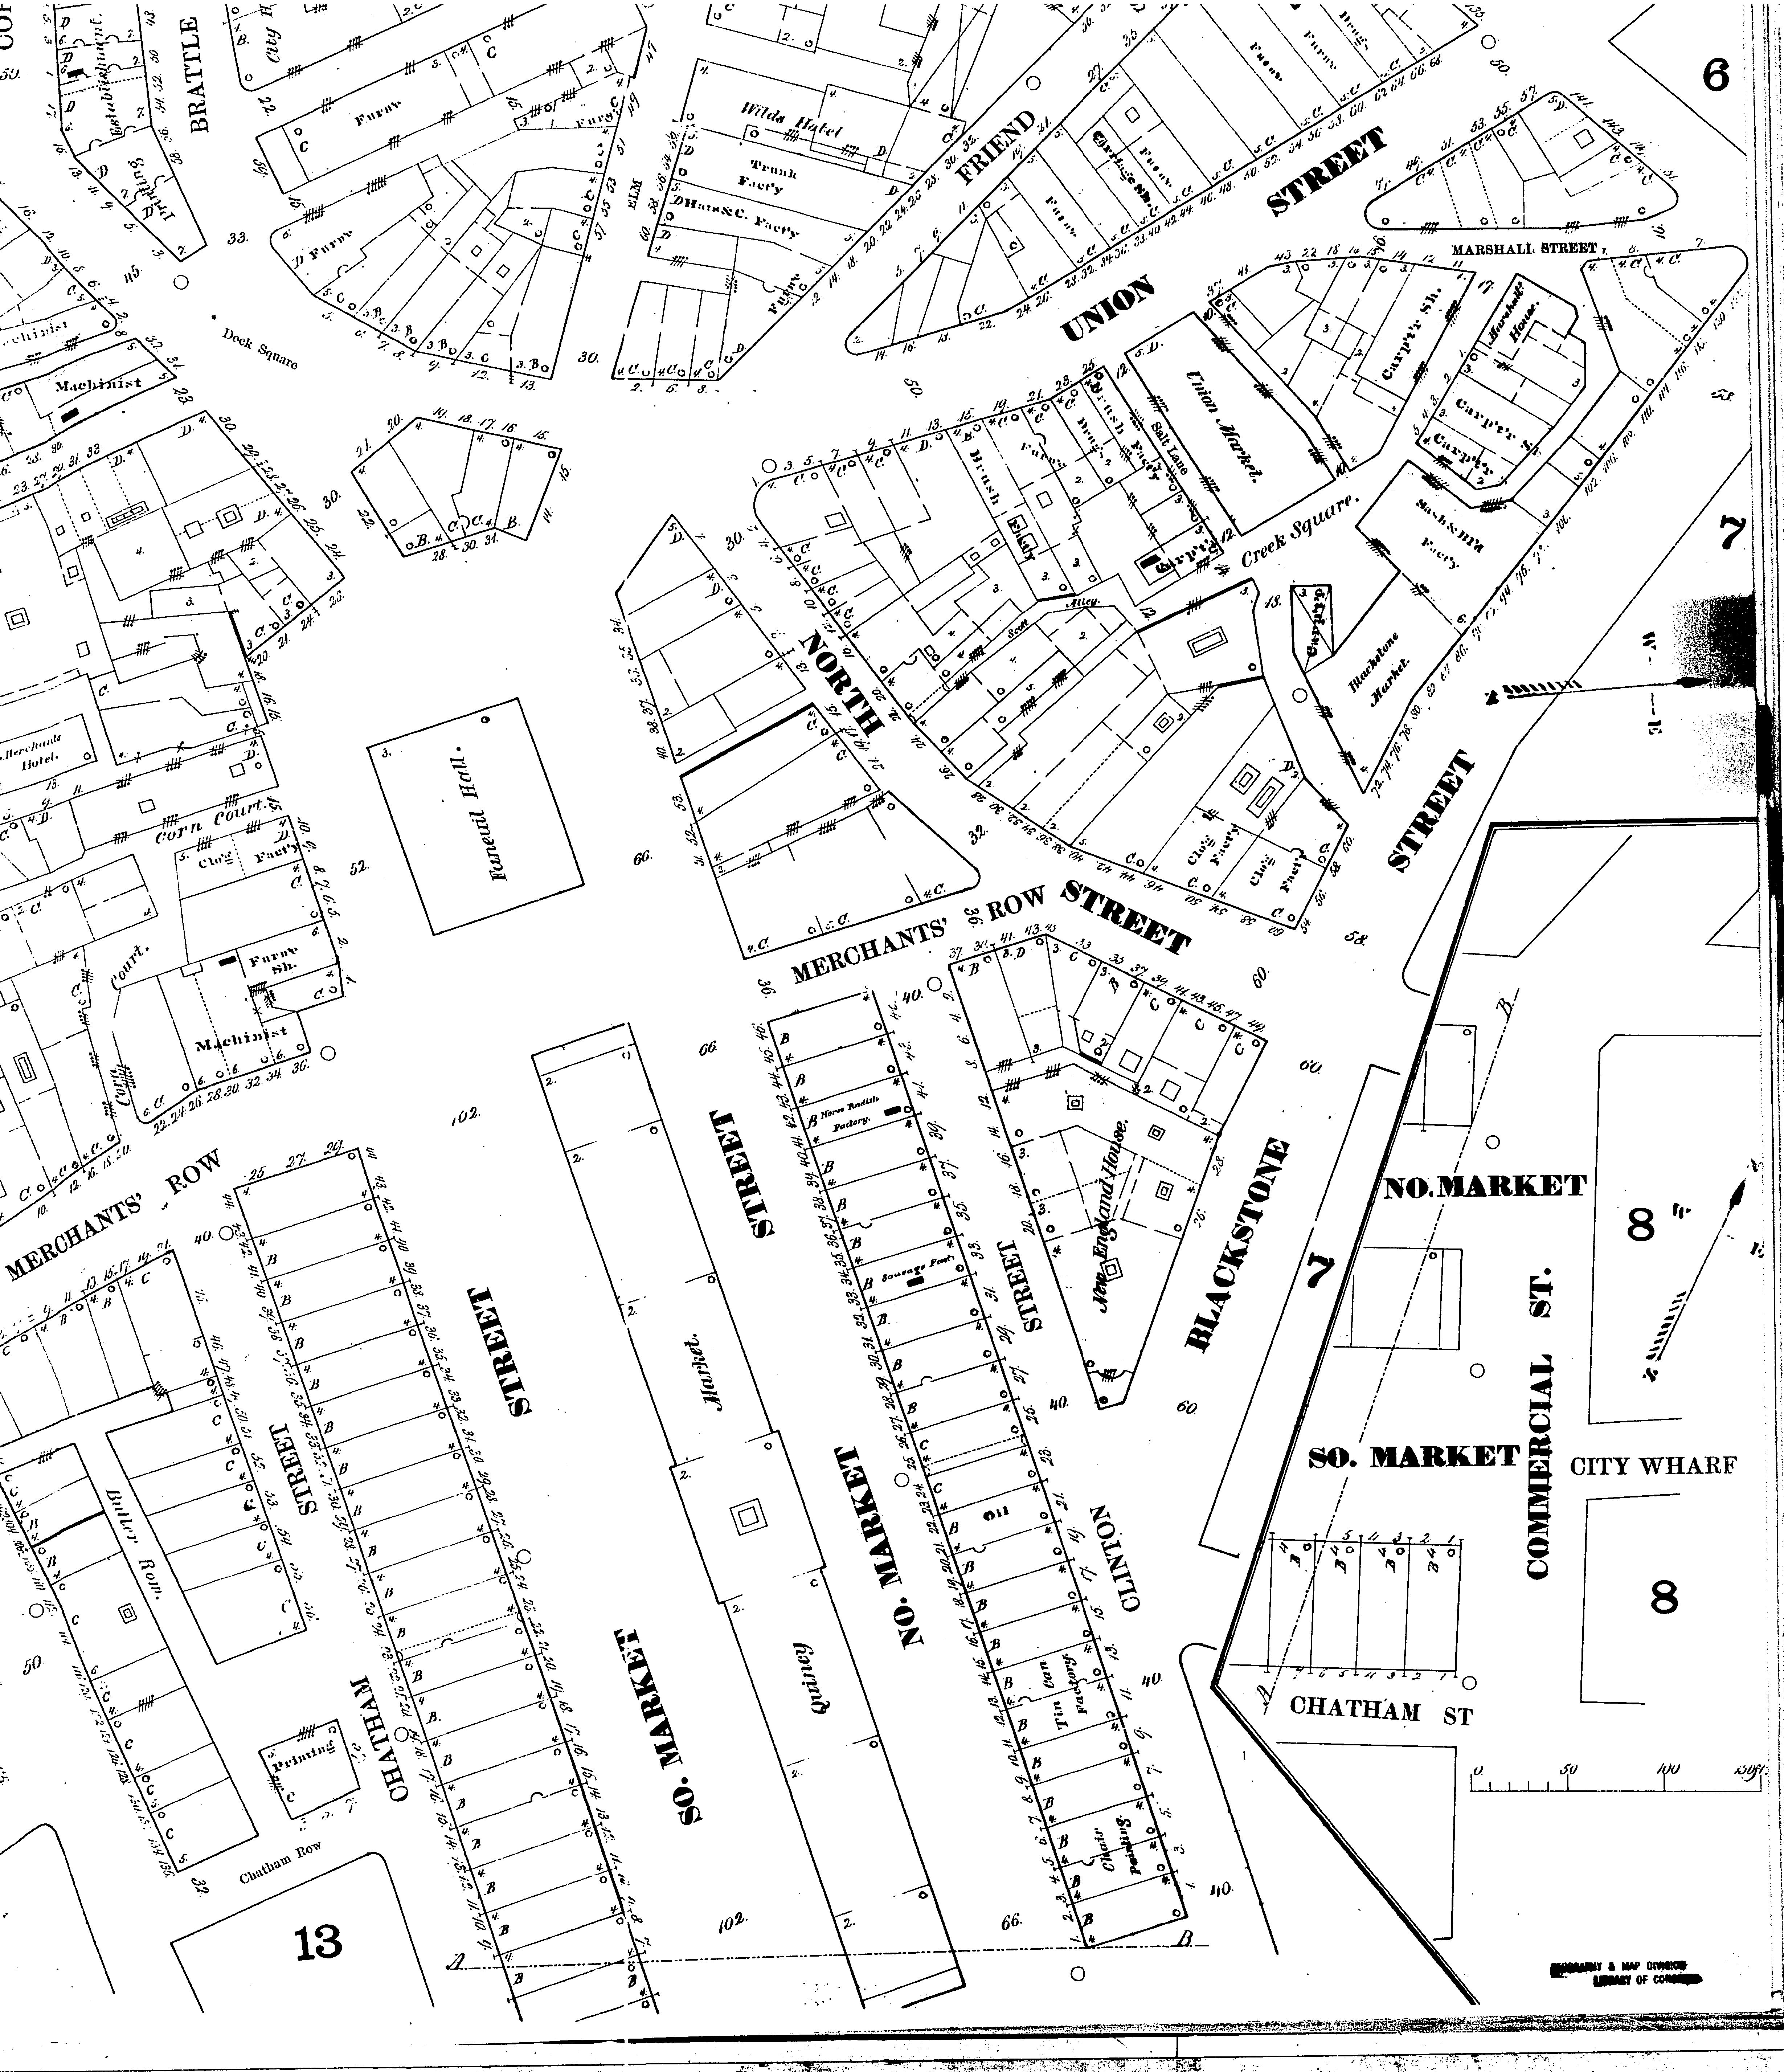
Comparing the Blackstone Block in the 1867 Sanborn to the later 1885 and 1909 Sanborn maps, then, reveals the patterns of change within ownership of properties. While the land use remains "commercial", as it largely has from the very beginnings of this site's development, the type of "commercial" use varies. Viewing the 1867, 1885, and 1909 maps at once reveals examples of such variation:


Note the types of businesses in the 1867 map. A sausage factory, a clog factory, a brush factory, and even a horse radish factory--along with a couple of markets and a carpenter's shop. The type of commercial land use is primarily of "production"--places that create the goods being sold.
Moving on to the 1885 map--now, Blackstone's oddly shaped properties are filled with tin shops, machine shops, woodworkers, furniture makers, and specialty stores. No factories. Looking at the 1909 map confirms this trend away from "production" and toward "service and distribution" businesses--the '09 map boasts a tavern, a plumber, a blacksmith's shop, two drugstores, and an engine shop. This last addition--the engine shop--is evidence of the beginning of the rise of the automobile during the early 20th century.
An anomaly to this pattern, however, lies in the sudden conversion of a group of Blackstone's southern buildings into cold storage, observable on the 1909 map. Yet this loss of industry from the buildings isn't merely a fluke, but an entirely separate trend--into the first half of the 20th century, this site declined greatly in market activity; up until the 1970s renovation, the Quincy Market buildings slowly deteriorated and began to be used for storage as well, and like the map shows, many of Blackstone's businesses either moved away or disappeared altogether. Two possible factors--both on the national level--in accounting for this decline are the Great Depression (with the stock market crash of 1929) and the steady trend of suburbanization that Jackson describes in his book. Boston was still growing as a city, and its center was shifting away from this site as the city boundaries grew outward and as people moved outward as well--this movement, combined with the rapid, heavy economic downturn of the Depression, could explain the loss of businesses and activity in the site.
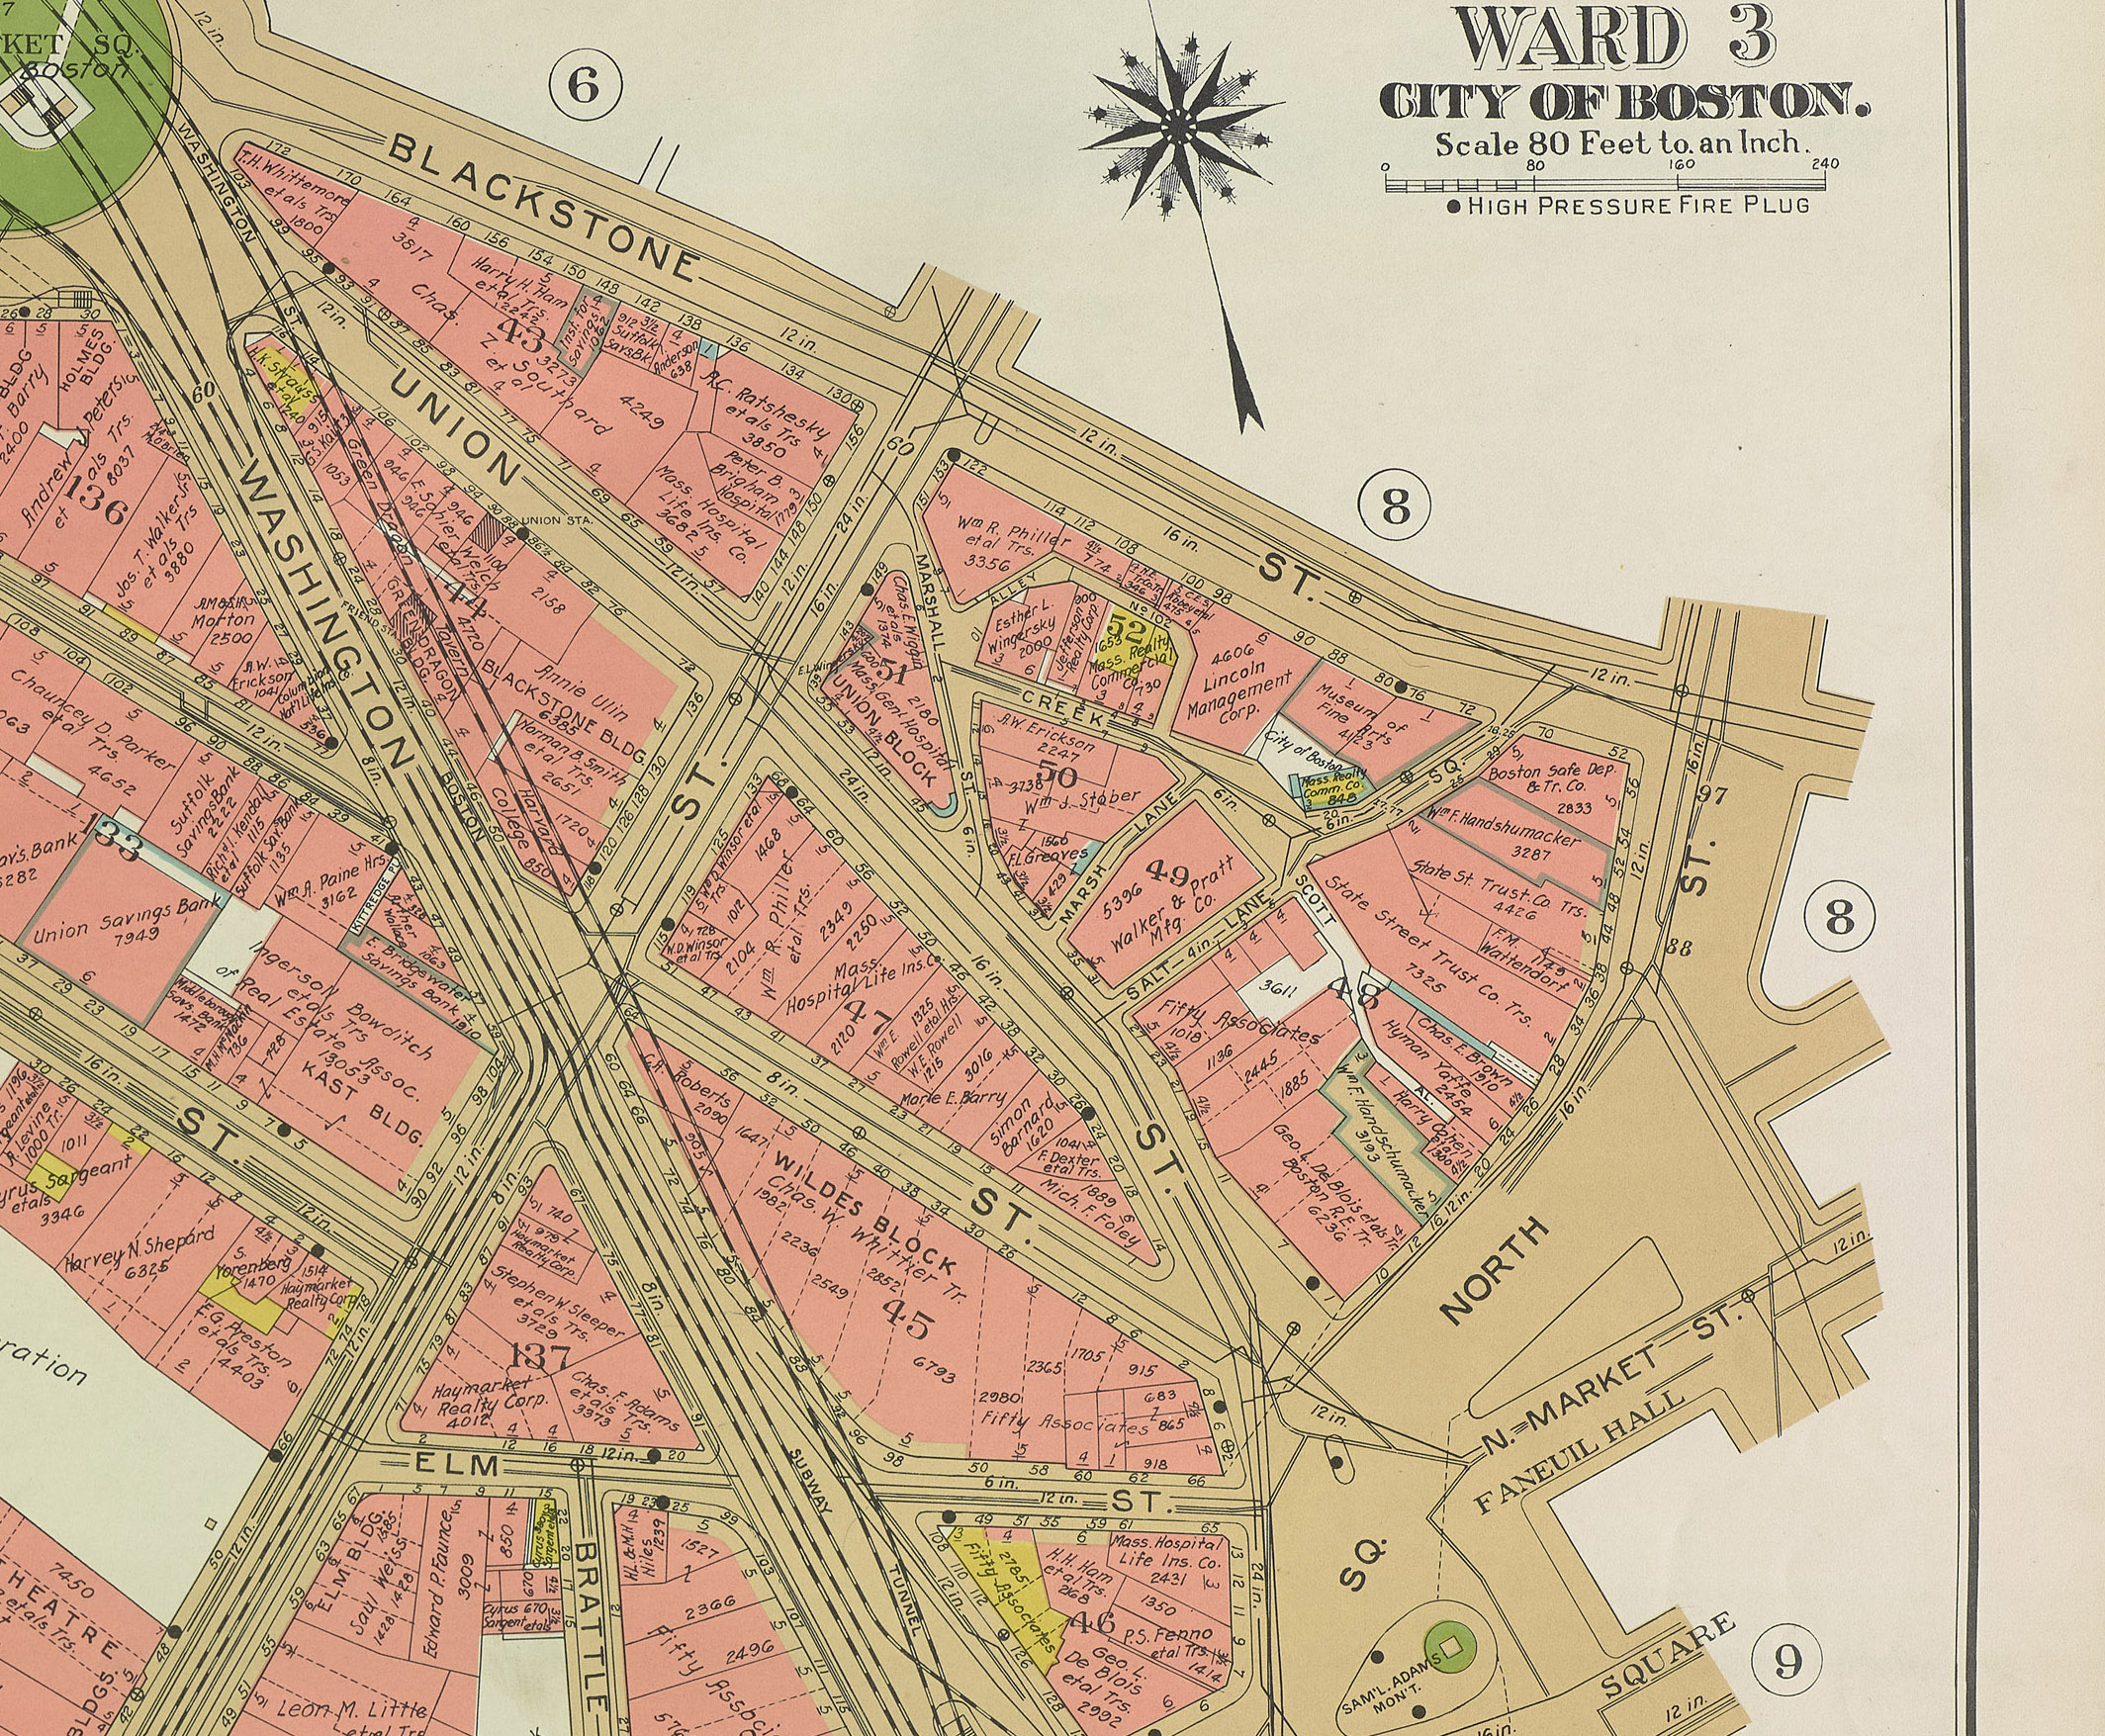
A section of a 1938 Bromley map depicting the Blackstone Block, shown below, shows the alteration of land use during this time of low commercial activity--institutions took up residence where the specialty shops used to be, such as a Museum of Fine Arts and Mass. General Hospital in the Union Block. Replacing the woodshops and drugstores are realty corporations and trading companies--who were likely wealthier than individual shop owners and thus able to buy out the properties as money became difficult during the Depression. A similar trend can be found in Quincy Market.
The decline of a previously lively, energetic marketplace could not, however, go unnoticed. By 1968, the City decided that something had to be done to revitalize the area--especially given that the new Government Center was directly adjacent to the faltering Faneuil Marketplace. To have a historically significant area like Blackstone and the Marketplace sit in disrepair next to the City Hall would be embarrassing. Accordingly, the City formed the Faneuil Hall Markets Advisory Council and allotted it two million dollars "...for market stabilization and restoration of roof lines and facades back to their 1826 appearance (Boston Landmarks Commission 1996, 7)"
This renovation plan, alongside the creation of New Congress St. from the connection of Congress St. and Portland St. (now known as just Congress St.) to the west of Blackstone Block and of an expressway to the Block's east, were the major agents of the changes that can be observed on the 1988 map below; the changes reflect the now-ubiquitous ownership of streetcars and the urban renewal movement that was growing in American cities during this time. As mentioned in the previous paragraph, it was as a part of a larger urban renewal plan that Quincy Market was renovated and reopened as a "festival marketplace"--one of the plan's main changes to the Market building is visible in the map, which was the creation of a central walkway down the length of the entire market (marked with a dotted line and labeled "corridor"), with spaces for food vendors on either side of it. In fact, this setup continues to be used for the present-day Market.

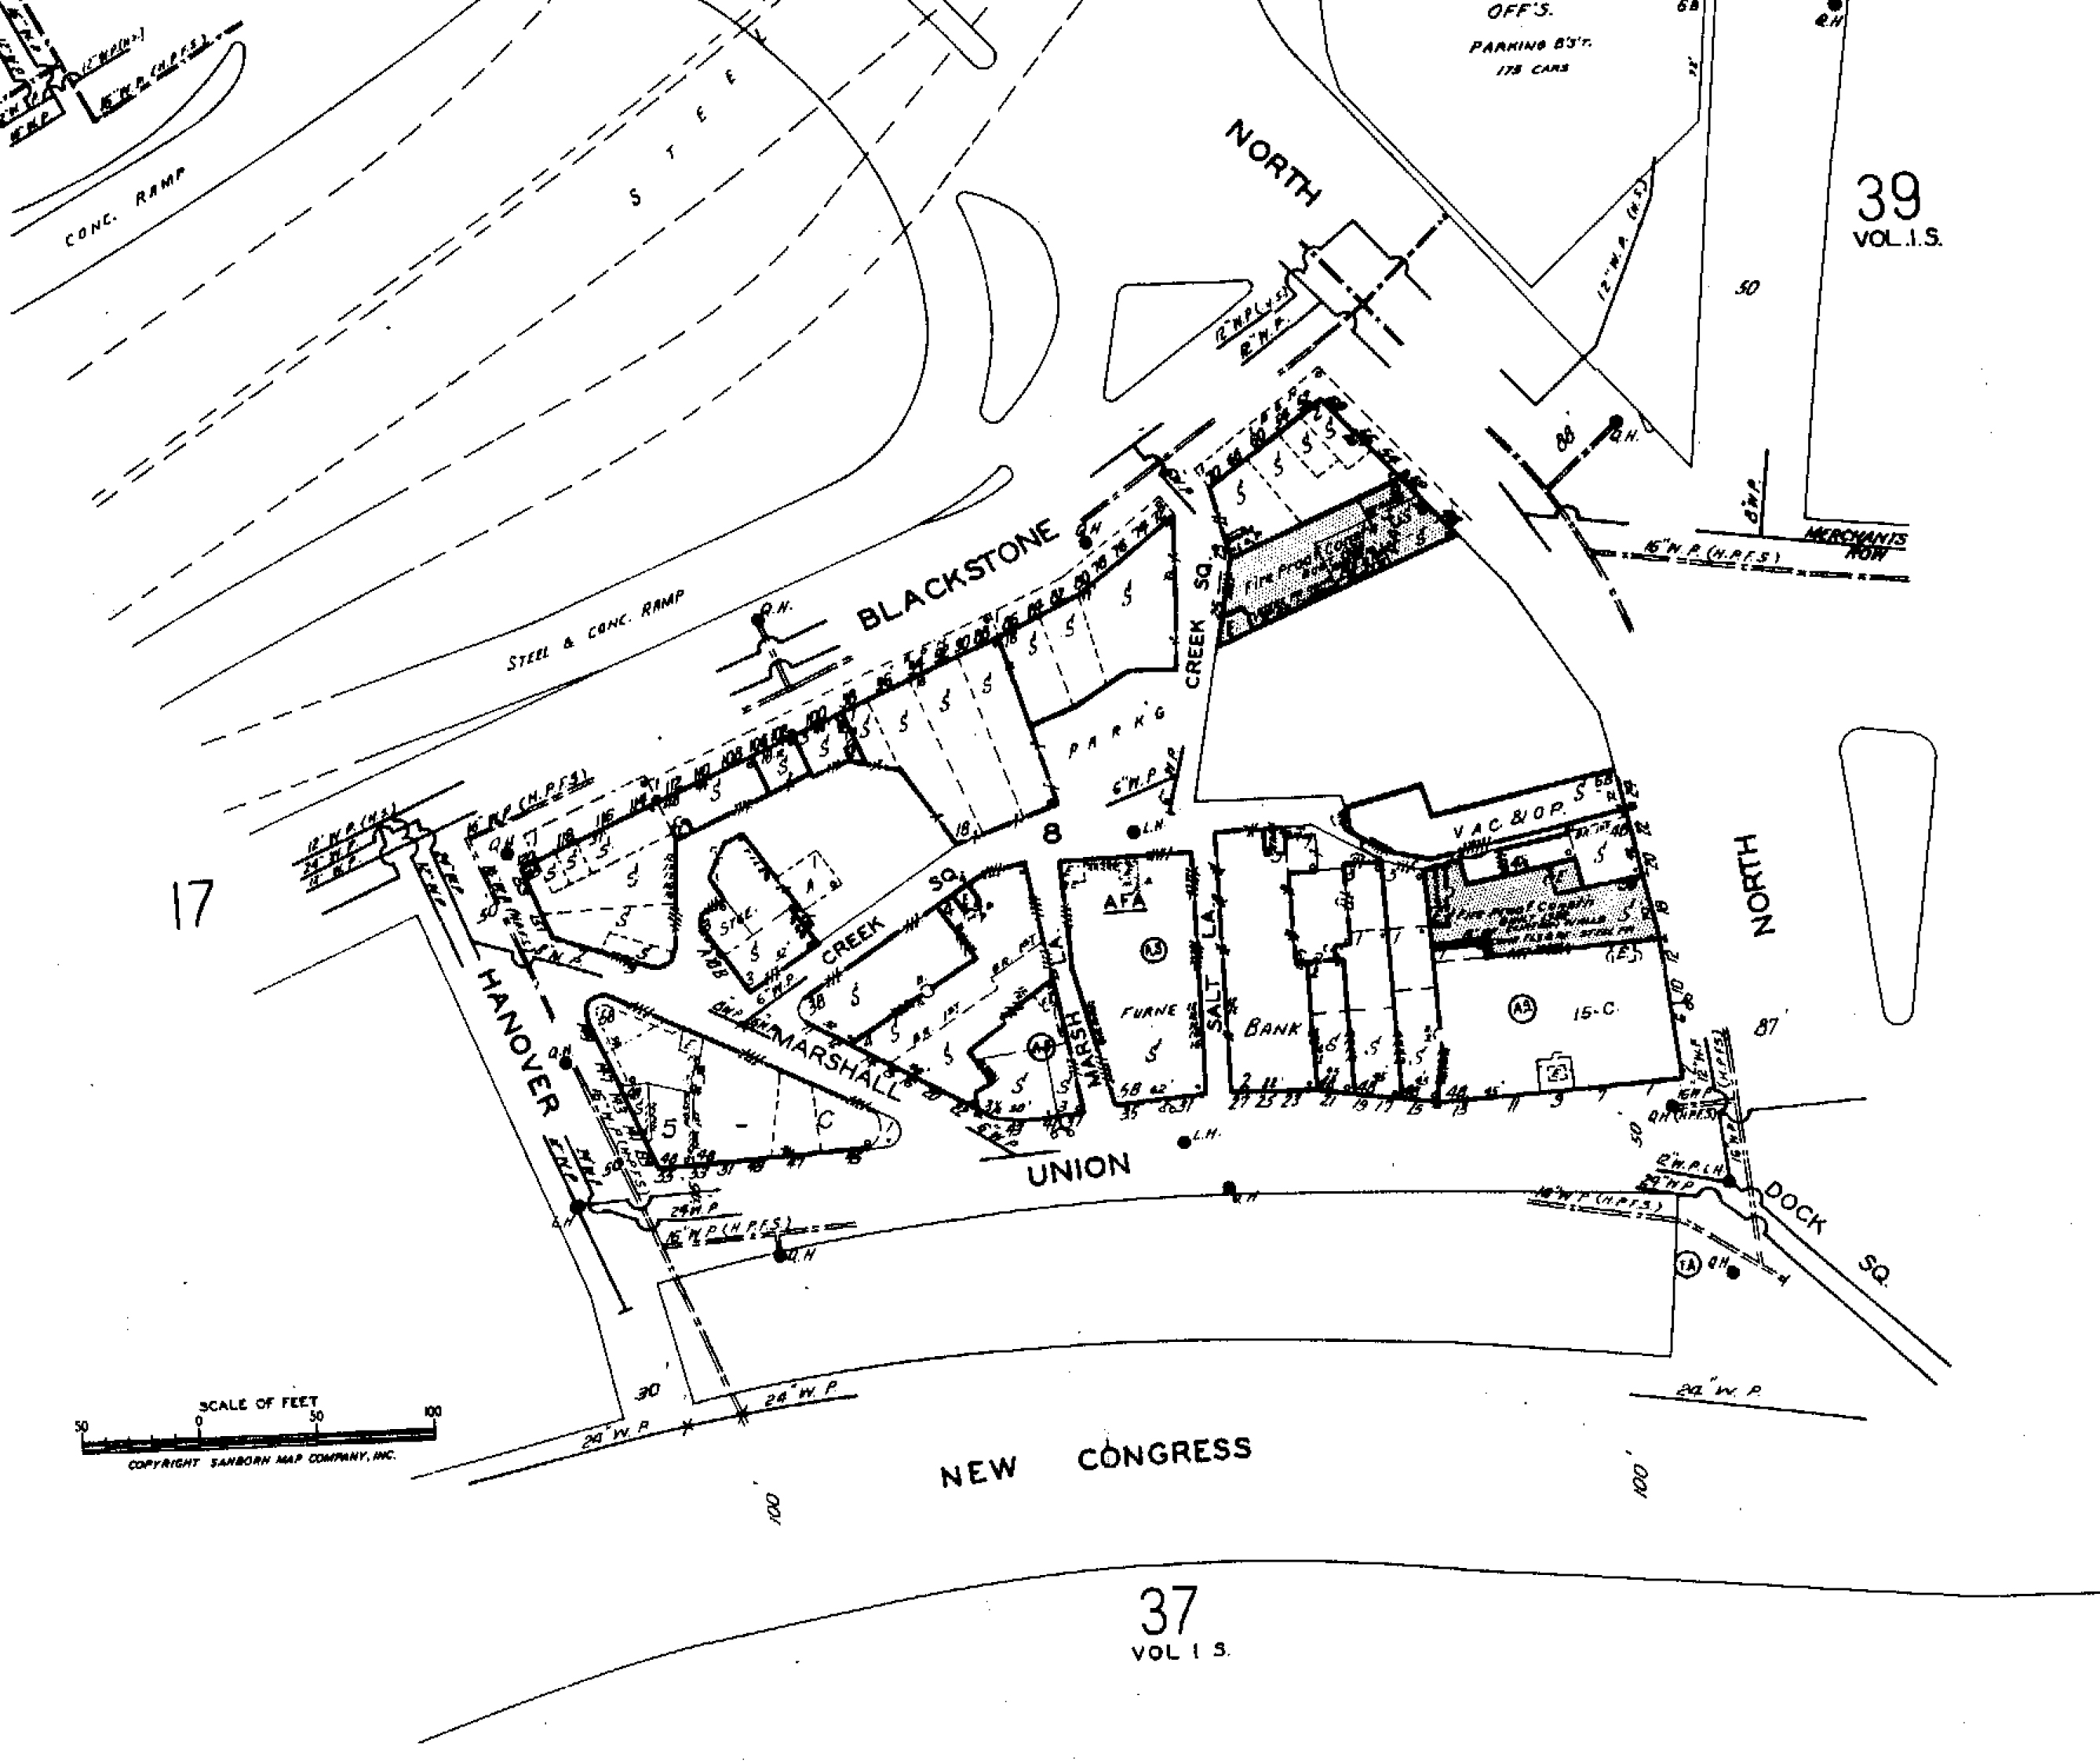
Parking lots not seen in the 1938 Bromley appear in both Blackstone Block and the Marketplace area, reflecting the influence of the major roads running along either side of the Block; in the city documents that were created by the Boston Landmarks Commission, it is clear that these two areas are and were recognized and designated as historically important areas, with the potential to draw tourists and, after the renovation, shoppers. As the Commission's report on the Marketplace describes, "Quincy Market reopened on August 26, 1976, its I50th anniversary, as one of the first "festival marketplaces" in the nation. (Boston Landmarks Commission 1996, 7)" And after its opening, the site began to revive, attracting crowds with the tripled appeal of historical landmarks, a shopping center, and a food court.
This revival continued to strengthen over the next few decades leading up to present day; a walk through the current site reveals a lively, bustling center of activity for locals and visitors alike. An example of a successful recovery of a declining urban area, the Marketplace has "returned" to its initial character of a busy, friendly shopping center. Blackstone today retains its significance as a city landmark, with its buildings still boasting the signature Boston red brick (a feature that, observable in the Sanborn maps, remains constant over the decades) and its street network still essentially the same as it was when the streets were first set down in the 1600s. On a macroscopic scale, the patterns of change observable in this site follow larger movements of the past few centuries that have affected almost all of urban America; the importance of water and the shoreline to early settlements, the Industrial Revolution and other technological advances, government interventions, economic changes, and as Jackson (1985) describes extensively in his book, the massive shift toward suburbanization in the 20th century. As an actively preserved part of the original downtown Boston, this site does not exemplify the build-up-tear-down changes brought on by those larger movements that can be seen in other parts of the city; nevertheless, changes in the usage and ownership of the site's properties reflect those movements in a more subtle way.
Resources
Boston Landmarks Commission. City of Boston, "Quincy Market". Last modified May 28, 1996.
Boston Landmarks Commission. City of Boston, "Faneuil Hall". Last modified September 2, 1994.
Boston Landmarks Commission. City of Boston, "Blackstone Block Street Network". Last modified April 26, 1983.
Jackson, Kenneth T. Crabgrass Frontier: The Suburbanization of the United States. New York: Oxford UP, 1985. Print.