

As an example of determining electrostatic complementarity through the examination of electrostatic potentials at the surface of molecules, here we examine the binding of the ligand barstar to the small bacterial ribonuclease from Bacillus amyloliquefaciens, barnase [1,2].
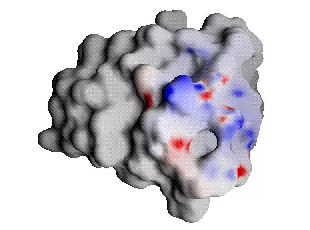
First, we examine the binding process using the standard method used by structural biophysicists. In this method, protein complementarity is determined by coloring the surface of the receptor and ligand based upon the respective total solvent-screened electrostatic potential of these molecules in the unbound state. Then, one looks for regions where the colors are opposite (for complementarity) or the same (for electrostatic clashes). For simplicity of comparison, instead of displaying these potentials on the different surfaces of each molecule, the receptor's (barnase's) potential was projected onto the ligand's (barstar's) surface.
The scale on all the following figures is (-15,0,30) for barnase's potential in GRASP notation and units of kT/e, where negative values are red and positive values are blue. For barstar and the complementary ligand the scale is (-30,0,15).
 |
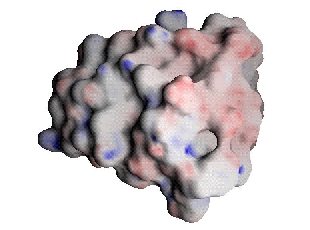 |
| Barnase potential projected onto barstar | Barstar |
Comparison of barnase and barstar indicates some regions that seem complementary and some regions that do not. The shortcoming of examining unbound potentials such as these is that they do not take into account the important free energy cost incurred through desolvation upon binding, and thus give an incomplete picture of the energetics involved. Furthermore, there is no meaningful comparison of these ligand and receptor surface potentials that gives a true indication of their complementarity in terms of the binding free energy.
If, instead of examining the electrostatic potentials in the unbound state, one compares the two components of the Residual potential, one does have a quantitative measure. For a complementary ligand, these two components must be equal in magnitude and opposite in value all over the ligand surface. For non-complementary ligands, the equivalence will not hold and differences in the potentials reflect regions of non-complementarity within the ligand [3].
The scales for the figures below are double those from above. 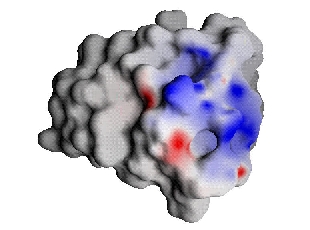 |
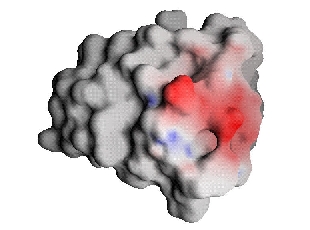 |
| Barnase bound-state potential (Interaction potential) projected onto barstar | Barstar desolvation potential |
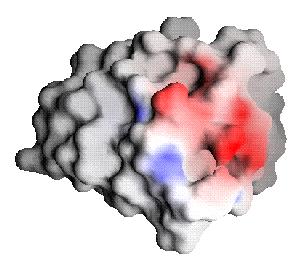 | |
| Complementary ligand desolvation potential |
From these images, one can once again see that barnase and barstar are fairly complementary; in fact, they seem much more complementary than indicated by Figure 1, differing on this scale at only a few places. Comparison, of the complementary ligand to barnase, reveals that the potential maps match almost exactly (the optimization procedure could be further refined with increased computational effort for a better match, but little additional binding free energy would result [2,3]). The Residual potential does indeed indicate complementarity.
These images were obtained using the GRASP computer program [4].
Scripts to automate obtaining similar images for other molecules along
with instructions for using them are given in the next page, Software.


![[Tidor Lab]](../images/blue_swirl/labhome_new.jpg)
![[Residual Pot.]](../images/blue_swirl/residual_new.jpg)
![[Definitions]](../images/blue_swirl/definitions_new.jpg)
