| home this issue archives editorial board contact us faculty website |
| Vol.
XVII No.
2 November / December 2004 |
| contents |
| Printable Version |
Not Another Survey!
Sometimes it must seem like you receive a request to complete a survey in paper or electronic format almost every day. And surveys take time to complete - and it's often hard to determine the relative worth compared to the effort. Surveys come from within MIT and from outside. What happens to the data and how is it used? This article will discuss the different MIT surveys, the rationale behind their conception and administration, how the data is used, and the usefulness of the results.
Although surveys can be and often are sent out by departments and offices throughout the Institute, a large proportion is administered by the Institutional Research Group within the Office of the Provost. This academic year, the Institutional Research Group will be administering major surveys to first-year students, faculty, graduate students, and alumni. All of these surveys are consortia-based – that is, they are being administered by other institutions as well. The Group also assisted in a transportation survey to the entire community.
Philosophy
The number of surveys administered by the Institutional Research Group has expanded over the past several years. Decisions about surveys are based on a few overarching principles.
• A broad-based survey is preferable to a special topic survey
• One comprehensive survey is preferable to multiple focused surveys
• A consortium/standardized survey is preferable to an MIT-only survey
• A Web-based survey with authentication is preferable to a paper survey
• Repetition of surveys on a regular schedule is preferable to administering multiple surveys over time to the same population.
• Timing is everything
• Survey results are illustrative, not predictive
Broad-based surveys that cover a variety of topics, such as the Faculty Survey administered in the spring of 2004 provide, incredible flexibility in the analysis of the data. The relationships and interactions among demographics, attitudes, and perceptions are often impossible to anticipate. A broad-based survey that covers a number of topics often provides a greater ability to investigate interactions. For example, data on levels of stress may predict general satisfaction, but unless you include factors such as workload, discipline, and rank, the genesis of the stress may be impossible to understand.
Broad-based surveys with core questions give us the ability to produce a variety of analyses over time, between populations within MIT and with our peers. Here are a few examples of how data has been used at MIT.
| Back to top |
Trend Analysis
Beginning with the spring of 2002, MIT began administering a survey to seniors every other spring. The survey asks seniors to rate departmental and institutional services.
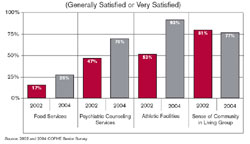
Figure 1 illustrates the change in measures of satisfaction for a number of central services. The increase in satisfaction with mental health services and athletics facilities is a direct reflection of the opening of the Z Center and increased resources in mental health services at the MIT Medical Department. By repeating core questions to similar populations, we are able to measure the effect of changes made.
Peer Comparisons
The Senior Survey also contained a number of questions about how students spend their time. Anecdotally, there is a cultural belief that students at MIT work harder than students at peer institutions. Because the Senior Survey was administrated simultaneously to a number of similar private institutions, we are able to compare what students self-report for hours spent on a variety of activities.
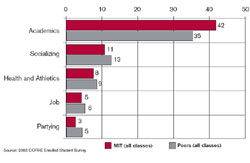
Figure 2 compares MIT to peers for hours spent on various activities. The peer schools are all private universities.
Cross Survey Analysis
Interesting analysis can be done when the same or similar questions are included in surveys administered to different populations. In the spring of 2004, all tenured and tenure track faculty were invited to complete a survey sponsored by the Provost. This survey included a number of questions that have allowed us to explore how faculty spend their time both in terms of hours and work load (number of classes, number of students, number of publications, etc.).
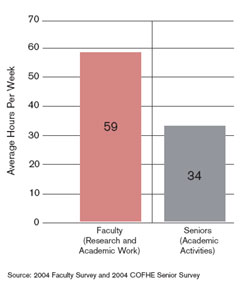
Figure 3 contrasts the number of hours seniors report spending in class, doing homework, and doing other academic work and the number of hours faculty report spending overall on academic, research, and administrative activities. Both surveys ask respondents to estimate an average over a week. As such, these surveys provide an insight to each group's perception of how they spend their time.
Analysis of subgroups of populations
One of the most valuable uses of data gathered through surveys is analysis by subgroups. These subgroups can be class year in the case of undergraduates; major/program/department/school for undergraduates, graduate students, and faculty; or even room in the case of the classroom study. Whenever possible, the Institutional Research Group provides schools and departments with an analysis of their population. These reports can be used internally for discussion and program review. Figures 4 and 5 illustrate two different types of subgroup comparisons.
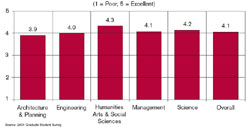
Figure 4 provides a comparison of graduate student responses by school on their satisfaction with overall program quality.
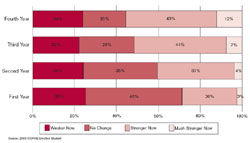
Figure 5 provides a comparison of whether students think that their ability to write effectively has changed since they enrolled at MIT by class year.
These graphs are illustrative of how data gathered from surveys can be used. Data can be examined using different administrations of the same survey, administrations of the same or similar questions to different populations within MIT, or the same questions to similar populations at other institutions.
The Institutional Research Group has assembled a rich set of data that is a resource for the community. The data can be used by academic and administrative departments, task groups and committees to examine student, faculty, alumni, and parent attitudes and opinions on a large number of topics. That being said, great care is taken to protect the confidentiality of individual responses, so while special analysis will be provided when requested, individual data sets cannot be provided.
To learn more about the data available and/or request special analysis, please contact Lydia Snover, Office of the Provost, Institutional Research, lsnover@mit.edu, 617-253-5838.
| Back to top | |
| Send your comments |
| home this issue archives editorial board contact us faculty website |