Overview:
Three dimensional volume imaging or investigation attracts
much research interest recently for its wide applications,
both in the military areas such as 3D LADAR and 3D terra-scope
and the civil areas, e.g. molecular biomedical investigation,
on-line industrial product inspection, micro-fabrication investigation,
etc. A field with fast growing importance is the 3D volume
investigation of the objects that show very fast dynamic changes
even in the range of microseconds, e.g. molecular biological
process, micro-fabrication process, etc.
Confocal microscope is the current most widely used 3D imaging
instruments. It utilizes a small pinhole at the confocal plane
to obtain depth discrimination (T. Wilson, “Confocal
Microscopy” Academic, San Diego, Calif., 1990). Recent
research also proposed new three-dimensional imaging methods
such as optical coherent tomography, which utilizes the phase
information acquired from the correlation of a broadband ultra-short
laser pulse to obtain the 3D spatial information (D. Huang,
E. A. Swanson, C. P. Lin, J. S. Schuman, W. G. Stinson, W.
Chang, M. R. Hen, T. Flotte, K. Gregory, C. A. Puliafito,
and J. G. Fujimoto, Science 254, 1178, 1991). Another approach
is to use the mutual coherence information from pairs of point
sources over the object to reconstruct the 3D object (D. L.
Marks, R. A. Stack, D. J. Brady, D. C. Munson, Jr., and R.
B. Brady, Science 284, 2164, 1999).
Volume holographic imaging
Basic principle of volume hologram imaging:
Generally speaking, hologram is an optical component in which
there exists some refractive index modulation. The most common
method to make a hologram is to use some photonic-sensitive
material to record the interference of two mutually coherent
light beams. For example, you may use a silver halide, and
let it exposure to the interference fringes of two laser beams.
Then you can develop the exposed silver halide to make an
amplitude hologram, or you can bleach it to a phase hologram
to future improve the diffraction efficiency.
Conventionally, people use hologram to record the 3D scene
of an object, as you may see in a lot of science museums.
Most of these holograms are called thin hologram, namely,
their have thin thickness, which is comparable to the wavelength
of the light. However, we mainly use volume hologram in our
research. Volume hologram typically has a thickness of more
dozens of wavelengths. Theories are usually used in treating
the optical behavior of the volume holograms are three dimensional
scalar diffraction theories or coupled wave theory, up to
the strength of the volume hologram. However, the easiest
way to understand volume hologram is treating it as a 3D diffractive
lattice and applying Bragg diffraction theory. As shown in
Figure 1, Volume hologram is recorded by two coherent beams
(fig. 1(a)), in which one is called signal beam and the other
is call reference beam. People found if the reconstruction
beam used to probe the volume hologram is identical to the
original reference beam respected to the wavefront profile
and propagating direction, a strong diffraction which propagates
along the signal beam propagating direction and preserves
identical wavefront profile with the signal beam is generated.
In this case, the volume hologram is called Bragg matched.
The diffraction vanishes very fast respected to the increasing
of the propagating direction deviation and/or wavefront profile
distortion between the probing beam and the reference beam.
In these cases, the volume hologram is called Bragg mismatched.
We used volume hologram as an agile depth selective lens in
imaging system to realize 3D imaging. Advantages of volume
holographic imaging (VHI) systems include more design freedom,
higher light efficiency, lower building cost, etc. According
to different illumination source, our research on volume holographic
imaging system mainly can be mainly divided into two categories.


(a) (b)
(c)
Fig.
1(a). Hologram is recorded with a point source at reference
location; (b) point source in focus Bragg-matches the hologram
and diffracts; (c) point source out of focus is Bragg-mismatched
and does not diffract.
Laser
Scanning Volume Holographic Imaging (LSVHI)
In LSVHI, the 3D object is illuminated a laser source. The
volume hologram used in LSVHI can be pre-recorded in two schemes.
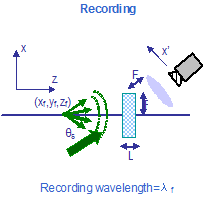
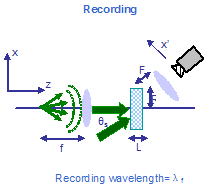
Spherical wave reference volume holographic imaging (SR-VHI)
(a)
(b)
Fig.
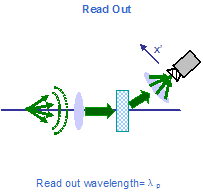
2. (a) Schematics for SR-VHI recording and (b) schematics
for SR-VHI read out.
In
this scheme, the volume hologram is recorded with a spherical
wave as reference and a planar wave as signal, as shown in
Figure 2. According to the Huygens principle, each point on
a laser illuminated 3D object can be treated as a secondary
point source. And, all these point sources emit optical power
to probe the SR-VHI in imaging process. However, according
to the Bragg diffraction theory, only the point source which
located at the position as the original reference point source
will Bragg match the volume hologram, therefore, SR-VHI can
only see that Bragg matching point source. Then, with applying
additional 3D mechanical scanning process, the 3D profile
of the object can be acquire. In conclusion, the working mechanism
of SR-VHI is similar to AFM or 3D stylus profiler in some
sense, but probing the object with a non-invasive optical
stylus.
Figure 3 shows an SR-VHI image of an artificial step-wised
object, where the optical stylus was scanning on the surface
of the letter “M”.


(a)
(b)
Fig.
3. SR-VHI image to a artificial step-wised object.
Planar
wave reference volume holographic imaging (PR-VHI)
Alternatively, in PR-VHI scheme, the volume hologram is recorded
with two planar waves, as shown in Figure 4.

(a) (b)
The
interference fringes inside the hologram are straight bands
along the y direction, which is called the degeneracy direction
of the hologram. So when the probing planar beam deviates
in the y-z plane, it still Bragg matches the PR-VHI. This
means all the point sources along the x=0 line on the focal
plane of the objective lens Bragg matches the volume hologram
and thus diffract bright images of a line on the Camera. However,
when the probing point source is shifted from the focal point
of the objective lens, the probing wave formed by the objective
lens will be spherical wave, which Bragg mismatches the PR-VHI.
Thus, the diffracted intensity captured by the camera drops.
Video
1 shows the PR-VHI response to a point source which is gradually
shifted off focus. You may see a vertical vanishing strip
inside an expanding disk area. The expanding disk is attributed
to the lens response to an off-focus point source, and strip
(which is more rigorously modeled by a sinc function along
the x direction) is attributed to the Bragg selectivity of
the volume hologram. Video shows the vanishing diffractions
of the PR-VHI to a probing line source which is gradually
shifted off focus.
Click
to see video1
Click to see video2
As PR-VHI Bragg matches to an on-focus line and also has depth
selectivity, when using PR-VHI in 3D imaging, a line-scanning
scheme can be applied to reduce the scanning. Figure 5 shows
the PR-VHI images to the same artificial object. A fast line
scanning method is used in acquiring the images; and the three
sets of images (three columns) correspond to scanning on the
surface of letter “M”, “I” and “T”
respectively.

Fig.
5. RP-VHI image for the artificial object. (a), (b) and (c)
focuses on letter “M”, “I” and “T”
respectively.
Broadband
and rainbow volume holographic imaging
PR-VHI is more efficient in 3D imaging because it expand the
field of view to a line from the SR-VHI’s tiny point
field of view. With broader field of view, very timing consuming
scanning mechanism can be reduced. A way to further increase
the field of view from a line to an entire plane is using
broadband illumination. In broadband illumination, each point
radiates a broadband optical power so that point sources which
on a band instead of on a line in the focal plane Bragg match
the volume hologram. Hence, the field of view increases to
the band from the line in PR-VHI; and the width of the visible
band increases with the increase of the light source bandwidth.
However, the expanding of the visible band or field of view
actually degrades the angular selectivity of lateral selectivity,
and consequently degrades the longitudinal selectivity even
faster, as the second order of field of view increasing. So
that broadband volume holographic imaging meets the difficulty
of the trade-off between field of view and imaging resolution.
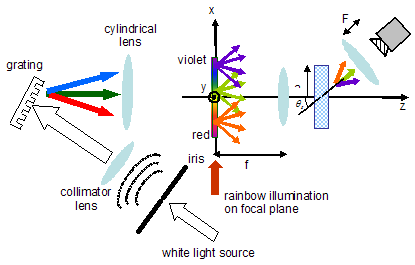
Fig.
6. Schematics for rainbow volume holographic imaging
A
very neat idea to solve this trade-off is to use rainbow illumination
in holographic imaging. In rainbow volume holographic imaging
(RVHI), as shown in Figure 6, a broad band light source is
first analyzed by a diffraction grating and the object is
illuminated by the decomposed rainbow. After passing through
a cylindrical lens, the rainbow is focused to the focal plane
of a volume holographic lens. The diffraction grating, cylindrical
lens, and the objective lens are chosen in such a way that
the rainbow projection on the focal plane satisfies the following
coupled angular-wavelength shifting relation
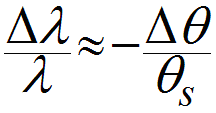
Where
λ is the recording wavelength; ΔΘ is the
desired angular shift to the optical axis of a color component
in the rainbow, which has a wavelength shift Δλ.
Therefore, all the in focus points along the x dimension are
Bragg matched; in the y they are also Bragg matched because
of degeneracy. Thus, the entire rainbow plane is Bragg matched,
resulting in a broad field of view (FOV). When shifted out
of focus, each point source in the rainbow becomes Bragg mismatched
due to defocus, much like a narrow-band source at the same
wavelength would. Hence high depth resolution can be preserved
as the FOV increase.
Figure
7 shows the using RVHI as a micro profilometer to measure
the surface profile of a MEMS micro turbine device. Figure
7(a) shows the rainbow projected on the micro turbine; figure
7(b) and (c) shows two images of the turbine which are taken
when RVHI was focused on the top surface and substrate respectively.

Fig.
7
BACK
TO TOP