|


|
|||||||||||
Light scattering from cancerous cells and tissuesMotivation Light Scattering Spectroscopy: Principle and Experimental Set-up
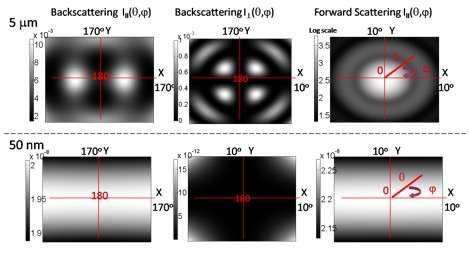
From the scattering point of view biological cells are weakly scattering with m<1.1. Also relative to the visible range of illumination wavelengths 400-700 nm some sub-cellular structures, such as nuclei or cells (5-20 um) are large, some are of the order of, such as nucleoli and mitochondria (150 nm – 2 um), and some are numerous in quantitaty, but small in size, such as protein complexes (10th of nm). We use Mie theory, which gives an exact numerical solution for scattering of a plane wave on a sphere to optimize azimuthal angles of collection φ for different size particles (Figure 2) [2].
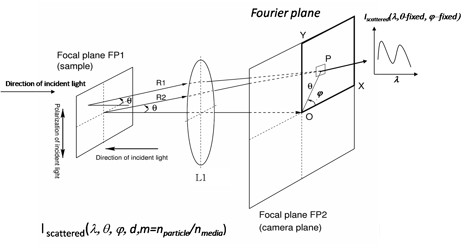
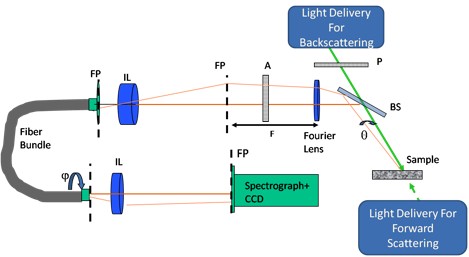
Images show Fourier planes for two particle sizes of 5 um and 50 nm for various polarization and scattering angle ranges for fixed wavelength of 550 nm. Backscattering and forward scattering is determined with respect to the direction of the incident beam (θ=0 – same direction as incident beam). The grayscale shows variation in scattering intensity. Analyzing absolute scales, we conclude, that forward scattering in angles 0-10 degrees is dominated by 5 um particle with a very large (~1010) factor in amplitude. Backscattering I⊥ has similar ratio of the 5 um to 50 nm signal intensity, but an absolute magnitude of 5 um signal is about 106 lower, then forward scattering. Finally, backscattering III has the largest contribution from 50 nm particle (~10-5). Moreover one can note, relative angular uniformity of 50 nm. Experimental set-up for collecting light scattering signals is presented on Figure 3. Light from broadband 75W Xe arc lamp is collimated using 4F-system to allow for control of beam diameter and divergence (not shown). The light delivered to the sample is linearly polarized by polarizer P. Scattered light is collected by a Fourier lens, which converts spatial distribution of scattered light intensity at the sample plane into 2D angular distribution of scattered light at Fourier plane (FP). Fourier plane is imaged through coherent fiber bundle onto an entrance slit of the spectrograph, which disperses a slice of the angular distribution I(θ,φ-fixed) in wavelength onto 2D CCD detector (θ,λ,φ-fixed). One end of the fiber bundle is free to rotate, allowing for different azimuthal angles, φ of scattering.
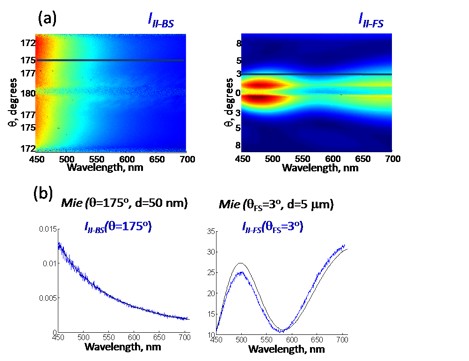
Measurements of Light Scattering in Beads, Cells and Tissues We use polystyrene micro/nano-spheres and Mie theory to calibrate our experimental set-up for absolute magnitude of the signal and distortions. The advantage of this sample type is a known value of refractive index and size distribution. Scattering maps I(l,q,j=const) for 5 mm and 50 nm bead mixture backscattering (III-BS) and forward scattering (III-FS) are presented on Figure 4a. Data were normalized to reflectance standard, which provides almost uniform response in angle, wavelength and polarization. Large particle spectra are oscillatory in angle and wavelength, unlike smaller ones. From comparison to Mie theory, it is obvious, that III-FS is dominated by large particles, while III-BS is dominated by smaller structures (Figure 4b).
Measurements of Light Scattering in Cells We use cell monolayers and cell suspensions to study light scattering at cellular level. Three types of cells are used in our light scattering experiments: HeLa, HT29 and T84.
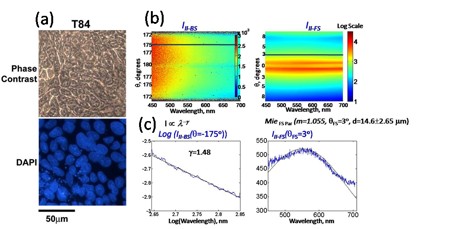
We can get information about overall structure of a cell sample by using phase contrast microscopy, as well as nuclear size distribution from DAPI-stained fluorescence image (Figure 5a). Scattering maps I(λ,θ,φ=const) for backscattering (III-BS) and forward scattering (III-FS) of the T84 cell monolayer are presented on Figure 5b. Forward scattering III-BS data were analyzed with Mie theory, where size distribution of the nuclei from fluorescence images was used to get an average index contrast m=1.055 (Figure 5c). Backscattering intensity III-BS followed an inverse power law behavior (I~λ-γ), which was a straight line on a log-log plot (Figure 5c). This type of behavior is characteristic of the smaller particles and one of the models to describe this behavior was developed in our tissue experiments [5]. References 1. Cotran RS, Kumar V, Collins T and Robbins SL. Robbins pathologic basis of disease, Saunders (1999). 2. Hulst HCvd. Light scattering by small particles, Wiley (1957). 3.Siglin JC, Khare L and Stoner GD. "Evaluation of Dose and Treatment Duration on the Esophageal Tumorigenicity of N-Nitrosomethylbenzylamine in Rats." Carcinogenesis, 16(2):259-265 (1995). 4. V. Backman, R. Gurjar, K. Badizadegan, R. Dasari, I. Itzkan, L. T. Perelman, M. S. Feld, “Polarized Light Scattering Spectroscopy for Quantitative Measurement of Epithelial Cellular Structures In Situ”, IEEE J. Sel. Top. Quant. Elect., 5, 1019-1026 (1999). 5. Hunter M, Backman V, Popescu G, Kalashnikov M, Boone CW, Wax A, Gopal V, Badizadegan K, Stoner GD, and Feld MS, Tissue Self-Affinity and Polarized Light Scattering in the Born Approximation: A New Model for Precancer Detection Phys. Rev. Lett. 97, 138102 (2006) |
|||||||||||

| [ Home | Overview | Research | People | Facilities | History | Events | Contact | MIT ] | Lab Intranet |