Multimodal spectroscopy (MMS)
Motivation
Atherosclerosis and cancer are the leading cause of death in many countries. Both diseases induce biochemical and morphological changes in the tissue, which can be targeted by spectroscopy. However, due to the complex nature of the disease progression, one type of spectroscopy is often not enough to accurately distinguish between normal and diseased tissue. Diffuse reflectance (DRS), fluorescence and Raman spectroscopy are distinct modalities that provide different types of information about the target tissue. The combination of these spectroscopic modalities, which is termed multimodal spectroscopy (MMS), provides complementary information about tissue composition. As such, MMS provides a more complete biochemical and morphological information that can be used in making a more accurate diagnosis. This calls for a portable MMS system that acquires reflectance, fluorescence and Raman spectra from a patient through a fiber-optic probe in a clinically relevant time frame.
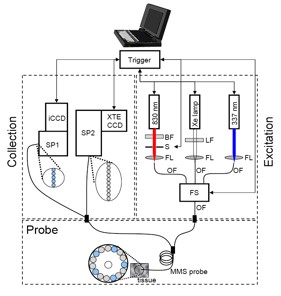
Figure 1. Schematic diagram of the MMS instrument
(BF = bandpass filter, LF = longpass filter, S = shutter, FL = focusing lens, OF = optical fiber, FS = fiber switch, SP1 = visible spectrograph,
SP2 = NIR spectrograph, iCCD = intensified charge-coupled device, XTE CCD = thermoelectrically cooled charge-coupled device.)
Instrumentation
The MMS instrument contains three excitation sources: a Xe flash lamp (L7684, Hamamatsu Corp., Bridgewater, NJ), a 337 nm N2 laser (NL100, Stanford Research Systems, Sunnyvale, CA), and an 830 nm diode laser (Process Instruments, Salt Lake City, UT) (Figure 1). These excitation sources are coupled sequentially to the MMS probe using an optical fiber switch. The MMS system uses two separate spectrograph/CCD modules: one optimized for NIR detection (Raman) and the other for visible wavelengths (reflectance and fluorescence). The 10 collection fibers carrying the Raman light are aligned in a linear array, effectively serving as an entrance slit to the spectrograph (Holospec f/1.8i, Kaiser Optical Systems), resulting in a 9 cm-1 spectral resolution. The spectrograph contains an 830 nm notch filter that further suppresses the elastically scattered Rayleigh light and a holographic grating to disperse the Raman scattered light onto a back-illuminated, deep-depletion CCD detector with a 1340×400 array of pixels (Spec10 XTE, Princeton Instruments/Acton, Acton, MA). The five collection fibers carrying the reflectance or fluorescence light are arranged into a vertical slit to a diffraction grating spectrometer (Spectra Pro 150, Princeton Instruments/Acton, Acton, MA), resulting in a 6 nm spectral resolution. The collected light is then dispersed onto an intensified CCD detector (PIMAX, Princeton Instruments/Acton, Acton, MA). The entire system can be mounted on a wheeled cart, which can be easily transported into and out of the operating room.
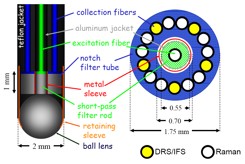
Figure 2. Schematic of the optical fiber MMS probe (left : side view, right : cross sectional view)
Optical Fiber MMS Probe
In order to efficiently transmit the excitation lights in the range of 300-830 nm, the Superguide fiber (200 μm diameter, 0.22 NA, Fiberguide Industries, Stirling, NJ) is used for the central excitation fiber. On the collection side, the Superguide fibers are used for the visible (DRS/IFS) and Anhydroguide fibers (200 μm diameter, 0.26 NA, Fiberguide Industries, Stirling, NJ) are used for the NIR (Raman). Out of the 15 collection fibers, five fibers are dedicated for DRS/IFS while 10 are dedicated for Raman (Figure 2). The optical fiber background is removed by inserting optical filters in the distal tip. The excitation fiber is filtered with a short wavelength-pass filter that transmits the excitation laser light (830nm) and blocks the background light generated in the probe. Conversely, the collection fibers are filtered with a long wavelength-pass filter that blocks the Rayleigh-scattered light and transmits the Raman light generated in the tissue. The central excitation fiber is optically isolated from the ring of 15 collection fibers by means of an aluminum jacket. The sapphire ball lens is tightly secured at the probe tip, and positioned at an appropriate distance from the fibers to insure a collimated beam of excitation light and efficient collection of light from the tissue.
Analysis of Multimodal Spectra
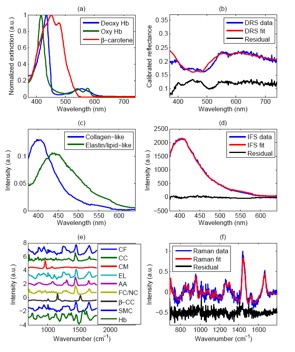
The DRS spectrum is obtained from the raw reflectance spectrum by subtracting the background spectrum and dividing by the background-subtracted response from a reflectance standard. The DRS spectrum is then fit with a model which includes b-carotene, oxy- and deoxy-hemoglobin as the main absorbers (Figure 3 (a), (b)). This provides a spectroscopic method to characterize the amount of hemoglobin and b-carotene in the tissue.
The intrinsic fluorescence spectrum (IFS) is obtained from the raw fluorescence spectrum by correcting for the effects of tissue turbidity using information obtained from the DRS spectrum. For the case of artery tissue, the IFS spectrum is then fitted with a model that consists of “collagen-like” and “elastin/lipid-like” fluorophores (Figure 3 (c), (d)). For the case of cancerous tissue, the model may include other fluorophores such as nicotinamide adenine dinucleotide (NADH). This provides a spectroscopic method to characterize the amount of different fluorophores in the tissue.
Raman spectrum is corrected for the system spectral response by dividing the raw Raman spectrum by the white light spectrum. Then the fiber background is removed by subtracting with the spectrum acquired from roughened aluminum. The remaining broadband tissue luminescence is removed by subtracting a polynomial that is fit to the data. This spectrum (Figure 3(f)) is analyzed with the corresponding tissue morphological basis spectra model (Figure 3(e)) by using ordinary least squares, which provides information about the relative contribution of the various chemical/morphological components of the tissue.
Figure 3. (a) Absorption coefficients used to model the tissue absorbers for DRS modeling; (b) representative data and fit for DRS; (c) basis spectra used to model IFS spectra; (d) representative data and fit for IFS; (e) Raman morphological basis spectra; (f) representative data and fit for Raman. The residuals in (b) and (f) are offset from zero for clarity.
Recent Publications
- O. R. Scepanovic, M. Fitzmaurice, J. A. Gardecki, G. Angheloiu, S. Awasthi, J. T. Motz, J. R., Kramer, R. R. Dasari, and M. S. Feld, “Detection of morphological markers of vulnerable atherosclerotic plaque using multimodal spectroscopy,” Journal of Biomedical Optics 11(2): 021007 (2006).
- Z. Volynskaya, A. S. Haka, K. L. Bechtel, M. Fitzmaurice, R. Shenk, N. Wang, J. Nazemi, R. R. Dasari RR, M. S. Feld, “Diagnosing breast cancer using diffuse reflectance spectroscopy and intrinsic fluorescence spectroscopy.” Journal of Biomedical Optics 13(2): 024012 (2008)
- J. T. Motz, S. J. Gandhi, O. R. Scepanovic, A. S. Haka, J. R. Kramer, R. R. Dasari, and M. S. Feld, “Real-time Raman system for in vivo disease diagnosis,” Journal of Biomedical Optics 10(3): 031113 (2005).
|
 |