Intrinsic Indicators of Pathological States: Refractive Index Maps and Membrane Fluctuations in P. falciparum Infected Human Red Blood Cells
Motivation
We present, for the first time, two intrinsic indicators that quantitatively and non-invasively elucidate the consequences on cell biomechanics of the malaria parasite Plasmodium falciparum (P. falciparum): three dimensional distributions of refractive index and the membrane fluctuations in P. falciparum infected red blood cells (Pf-RBCs). These properties can be used to systemically study the patho-physiology of human malaria disease. During the intra-erythrocytic development, P. falciparum causes structural, biochemical, and mechanical changes to host RBCs. Major structural changes include the growing of vacuole of parasites inside host RBCs, loss of cell volume, and the appearance of small, nano-scale protrusions on the membrane surface [1]. From the biochemical standpoint, a considerable amount of hemoglobin (Hb) is digested by parasites during development and converted into insoluble polymerized forms, known as hemozoin. Hemozoin appears as brown crystals in the vacuole of parasite in later maturation stages of Pf-RBCs. Two major mechanical modifications are loss of cell deformability and increased adherence of Pf-RBC membrane to vascular endothelium and other RBCs. These changes lead to sequestration in microvasculature in the later stages of parasite development, which is linked to vital organ dysfunction in severe malaria [2].
Methods
1. Diffraction Phase Microscopy: An Ar++ laser (l=514 nm) was used as illumination source for an inverted microscope (IX71, Olympus). The microscope was equipped with a 40´ objective (0.65 NA), which facilitates a diffraction-limited transverse resolution of 400 nm. With the additional relay optics used outside the microscope, the overall magnification of the system was approximately 200´. EMCCD (Photonmax 512B, Princeton Instruments, Inc.) was used to image interferogram. DPM employs the principle of laser interferometry in a common path geometry and thus provides full-field quantitative phase images of RBCs with unprecedented optical path-length stability. The instantaneous cell thickness map is obtained as  , with , with the quantitative phase image measured by DPM. The refractive index contrast the quantitative phase image measured by DPM. The refractive index contrast between the RBC and the surrounding PBS is mainly contributed to the Hb, which is optically homogeneous in cytosol. We employed tomographic phase microscopy (TPM) to retrieve 3-D refractive index for all the stages of Pf-RBCs and healthy RBCs. The DPM optical path-length stability is 2.4 mrad, which corresponds to a membrane displacement of 3.3 nm. 1 between the RBC and the surrounding PBS is mainly contributed to the Hb, which is optically homogeneous in cytosol. We employed tomographic phase microscopy (TPM) to retrieve 3-D refractive index for all the stages of Pf-RBCs and healthy RBCs. The DPM optical path-length stability is 2.4 mrad, which corresponds to a membrane displacement of 3.3 nm. 1
2. Tomographic Phase Microscopy: Tomographic phase microscopy (TPM) is a technique that can map the 3-D distribution of refractive index in live cells and tissues. In TPM, the sample-induced optical phase shift is imaged using a phase-shifting heterodyne interferometer. Phase images are recorded by varying the directions of illumination. The angle of illumination ranges from -60 to 60 degree and angular step is 0.2 degree. It takes about 10 seconds to scan the entire angular range. Phase image at each step of angle corresponds to angular projection of refractive index at the illumination angle. The custom built microscopy and CMOS camera (FASTCAM 1024 PCI, Photron, Inc.) were used to measure interferograms. With the set of angular projection phase images, a filtered back-projection algorithm is used to calculate a 3D refractive index. The transverse and axial resolutions are 0.3 and 0.6 mm, respectively, and the accuracy of index measurement is 0.001.
Results and discussion
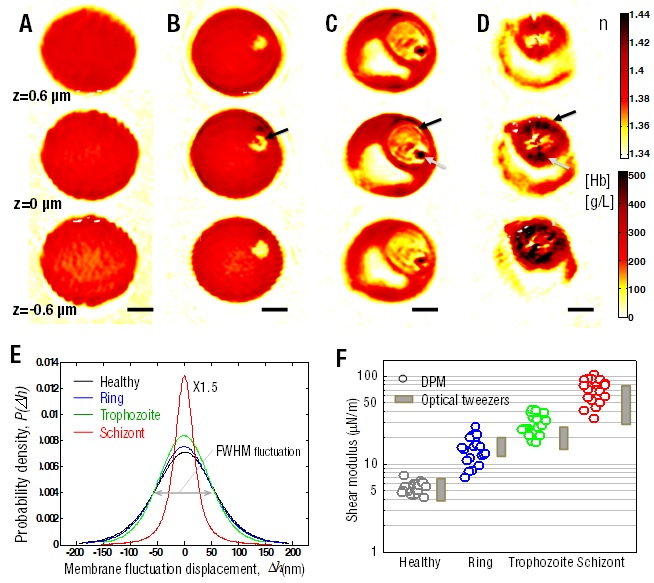
The refractive index maps of Pf-RBCs measured by tomographic phase microscopy show the morphological alterations of host RBCs and the structures of vacuoles of parasites as well as growing of hemozoin. In addition, the refractive index is translated into quantitative information about Hb content of individual Pf-RBCs. During the intra-erythrocytic stages of P. falciparum, we show the decrease of both the total amount and the concentration of Hb in the cytoplasm of Pf-RBCs, as shown figs.1A-D. Thermally driven membrane fluctuations in Pf-RBCs are strongly correlated with the mechanical properties of cell, which is significantly modified by the specific proteins exported by P. falciparum during developmental stages. Fluctuations in Pf-RBCs membrane measured by diffraction phase microscopy, are used to characterize the membrane stiffness by determining the in-plane shear modulus. We show that membrane stiffness increases progressively with parasite development (Fig.1E).
In particular, the in-plane shear modulus at the schizont stage is up to an order of magnitude higher than that for healthy RBCs (Fig. 1F). These results indicate that parasite development stage directly correlates with the amplitude of membrane fluctuations. We also present experimental results of membrane fluctuations in Pf-RBCs over the full range of intra-erythrocyte stages at both normal body and febrile temperatures, representative of malaria fever episodes. Parasite interactions with host RBC strongly correlate with temperature-dependent and stage-specific alterations to membrane dynamics. We critically assess the hypothesis that after exposure to febrile temperature, Pf-RBCs at body temperature display deformability closer to those at febrile temperature.
In summary, we report the first experimental connections between these intrinsic indicators and pathological states. These intrinsic optical properties could provide insights into possible mechanistic pathways in the pathogenesis of malaria, as the parasite alters biomechanical properties of RBCs. Our systematic experiments cover all intra-erythrocytic stages of parasite development under normal body and febrile temperatures. These findings offer potential, and sufficiently general, new avenues for identifying, through cell membrane dynamics, pathological states that cause or accompany human diseases.
|
Figure 1: Three dimensional refractive index maps of Pf-RBCs during all intra-erythtocytic stages reveal the structural modifications and the hemoglobin concentration of cytoplasm. (A-D). Membrane fluctuations and in-plane shear modulus at different intra-erythtocytic stages of Pf-RBCs. (E-F) (A) Healthy RBC. (B) Ring-. (C) Trophozoite-. (D) Schizont-stage. Images in row show three different cross sections: 0.6 µm above (top), at the focused plane (middle), and 0.6 µm below the focused plane (bottom). Black arrows indicate the location of P. falciparum, and the gray arrows the location of hemozoin. Color-maps show the refractive indexes (top right) and Hb concentration. mm. (E) Histograms of cell thickness fluctuation of Pf-RBCs. (Histogram of the schizont stage is scaled down by a factor of 1.5). (F) In-plane shear modulus of the RBC membrane versus developmental stage of Pf-RBCs. The in-plane shear modulus is calculated from the in-plane membrane displacement.. Also shown for comparison are the estimated from optical tweezers [2]. Scale bar 1.5 μm. |
Recent publications
1. Park, Y.K., Popescu, G., Badizadegan, K., Dasari, R.R. & Feld, M.S. Diffraction phase and fluorescence microscopy. Opt. Exp. 14, 8263-8268 (2006).
2. Park, Y.K., Diaz, M, Popescu, G, Lykotrafitis, G, Feld, M.S. and Suresh, S. Refractive index maps and membrane dynamics of human red blood cells parasitized by Plasmodium falciparum. Proceedings of the National Academy of Sciences 105, 13730 (2008).
|
 |