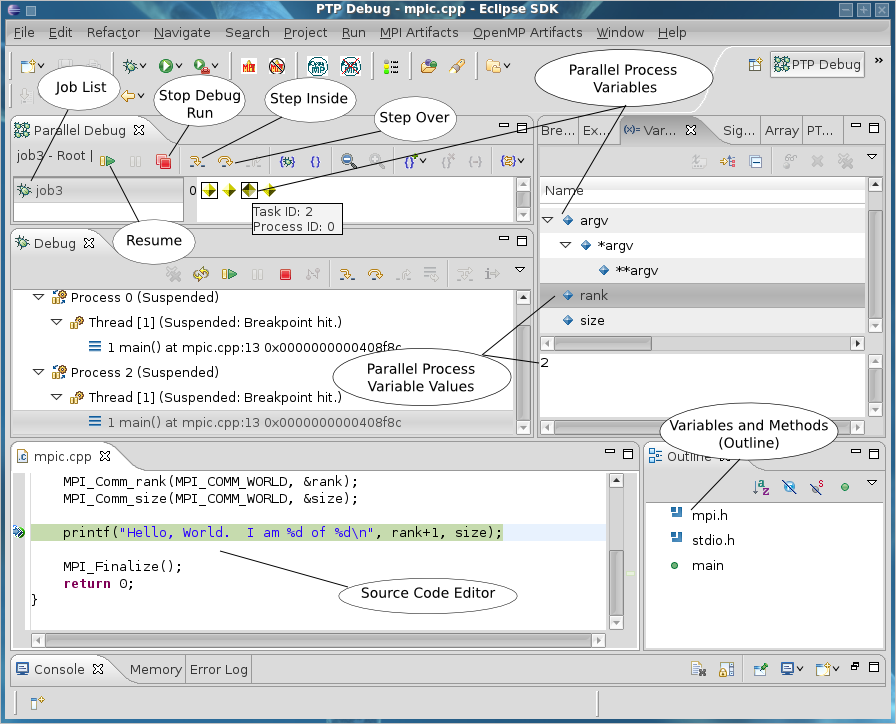
The image below outlines the PTP Debugging Perspective in Eclipse
Job List - List of parallel executions. Anytime you do a parallel run or parallel debug, a new job will appear in this list. Running a parallel debug will automatically select the appropriate job and show you its processes. Provided you've set a parallel breakpoint, all of your process/task icons should be yellow indicating the process is stopped (at the breakpoint). See the section entitled “Task/Process Color Codes” for more information about parallel task/process status.
Debug Functions
Parallel Process Variables- This is a list of variables in a given process. Double clicking another process will refresh the list with that process's variables.
Parallel Process Variable Values - Clicking on a variable in the parallel process variable list will cause its value to be shown here (see image below).
Outline - provides an overview of the source code file's variables and methods
Source Code Editor - In the debug perspective, the source code editor highlights the line of code currently being debugged. In general the source code editor provides syntax highlighting and content assistance (drop-down apis, code completion, etc)
Console - view project compilation output (GNU make build)