Measuring social influence among homophilous communities
Decision-making on networks can be explained by both homophily and social influence. While homophily drives the formation of communities with similar characteristics, social influence occurs both within and between communities. Social influence can be reasoned through role theory, which indicates that the influences among individuals depend on their roles and the behavior of interest. To operationalize these social science theories, we empirically identify the homophilous communities and use the community structures to capture the “roles”, which affect the particular decision-making processes. We propose a generative model named Stochastic Block Influence Model and jointly analyze both the network formation and the behavioral influence within and between different empirically-identified communities. To evaluate the performance and demonstrate the interpretability of our method, we study the adoption decisions of microfinance in an Indian village. We show that although individuals tend to form links within communities, there are strong positive and negative social influences between communities, supporting the weak tie theory. Moreover, we find that communities with shared characteristics are associated with positive influence. In contrast, the communities with a lack of overlap are associated with negative influence. Our framework facilitates the quantification of the influences underlying decision communities and is thus a useful tool for driving information diffusion, viral marketing, and technology adoptions.

Graphical representation of the Stochastic Block Influence Model (SBIM).
Assume there are two communities, a high socioeconomic status (SES) group (colored in dark blue) and low SES group (colored in dark red), characterized by multi-dimensional sociodemographic features. The two groups have higher intra-class connection probability and lower inter-class connection probabilities. The decision-making of A is jointly influenced by her preferences, as well as her neighbors from the same and different communities.
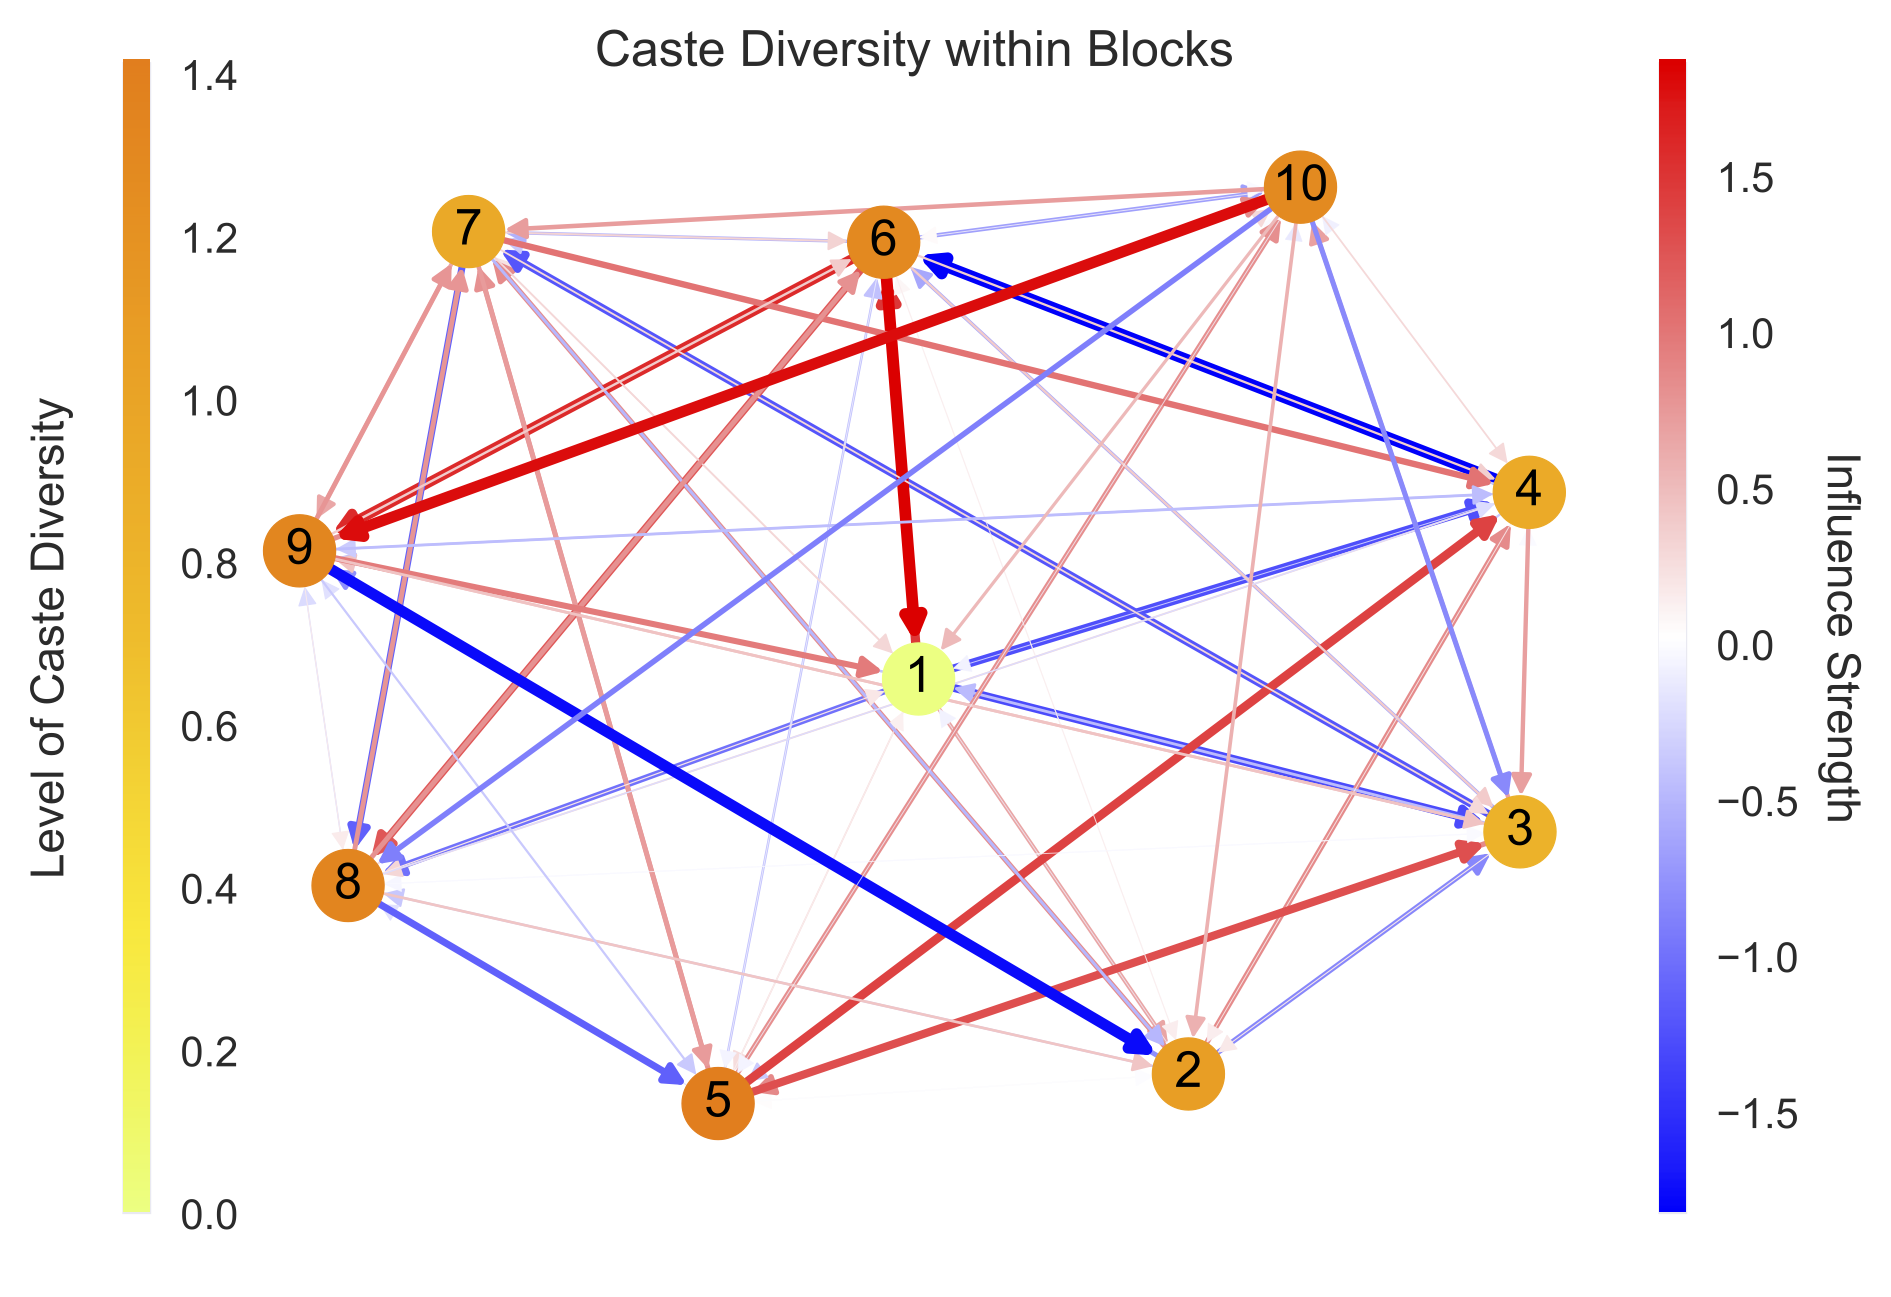
Sociodemographic analysis of each social block and the social influence across social blocks.
Each node represents a social block corresponding to the index shown in the previous in Table 2. The directed links represent the strength of social influence varying from strong negative (blue) to strong positive (red). The color of the node represents a measure of the sociodemographic characteristics within that social block. We display here the specific characteristic of caste diversity within each block as an example.
The article is available here.