Massachusetts Institute of Technology - Department of Urban Studies and Planning

11.520: A Workshop on Geographic Information Systems
11.188: Urban Planning and Social Science Laboratory

Project Preparation, Online Data, and Misc. Tools


November 24, 2010, Joseph Ferreira, Jr.


Administrative

  • Are you caught up on Labs (#8) and Homework (#3, part 2) before Thanksgiving break?
  • Have you turned in your project mini-proposal?
  • Have you identified enough data (and a narrow enough topoic) that you have a feasible project?


Outline for Today

  • Mostly individual project conversations plus comments about the following topics
  • Review and consolidate recent tips and illustrations regarding
    • model builder
    • raster operations (especially zonal statistics and environment settings)
    • project work
      • online data sources
      • GIS services from MIT Libraries
      • project management
  • Overview of additional ArcGIS tools beyond scope of class
    • network analysis (shortest path, allocation, ...)
    • terrain and 2.5D modeling


Review and consolidate recent tips


Network Analysis - repeat of previous lecture notes (that we never covered)

  • Encoding proximity using a network (or graph) model, facilitates certain types of connectivity analyses
    • Find shortest path along streets from Point A to Point B
    • Find shortest path through N cities (Traveling Salesman problem)
    • How far can you get in 30 minutes
  • Many transportation analyses use network data models
  • Many hydological analyses use network data models (runoff, flow, ...)

Network Example: using US Census Bureau, TIGER Line Files

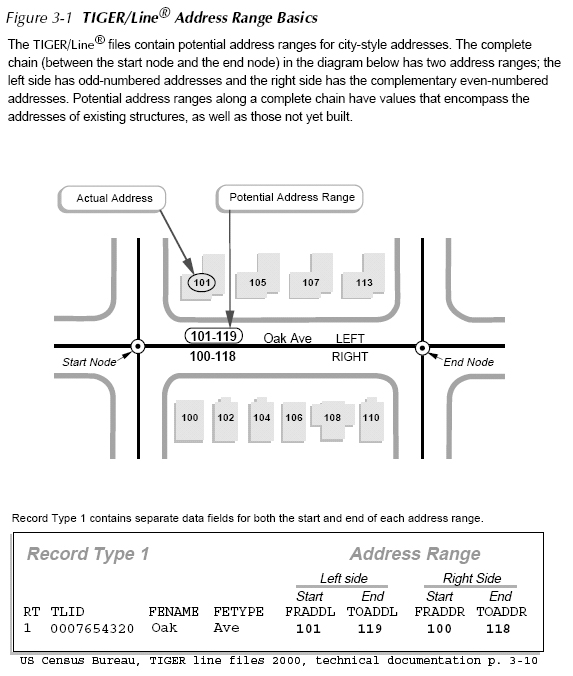
  • Geocoding Strategy using TIGER
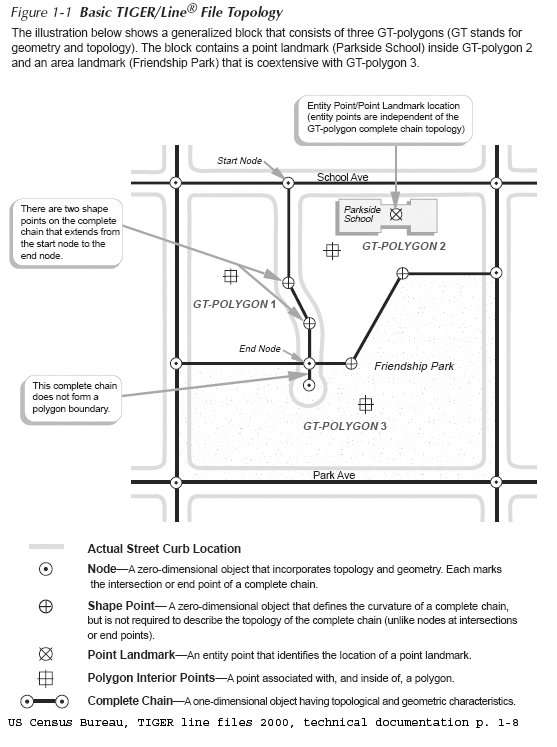
    • Encode road network as street centerlines links connecting nodes (usually intersections)
    • Attach address information to each street segment
    • Use 'in reverse' to match street address to street segment to get approximate X,Y location
  • TIGER: Topologically Integrated Geographic Encoding and Referencing system
    • Examine attribute table and note columns for to/from information
    • http://www.census.gov/geo/www/tiger/
    • US Census Bureau TIGER line file 2000, technical documentation
      • at Census: http://www.census.gov/geo/www/tiger/rd_2ktiger/tgrrd2k.pdf
      • in class locker: http://mit.edu/www/data/census2k/tiger_tgrrd2k.pdf
  • Illustrative Example
    Street centerline road segments
    Attaching address ranges to road segments


What is a Network?

A network is a system of linear features connected at nodes
E.g, nodes could be where three or more street segments intersect.
The linear feature connecting any given pair of nodes is called an arc, or network link.
Each arc on a network is represented as an ordered pair of nodes, in the form from node i to node j, denoted by (i, j), and thus has direction.
A network representation that is good for transportation modeling may differ from a geographically accurate representation of the physical road (e.g., street centerline, handling exit ramps, 3D overpasses, etc.)


Other basic elements of a network:

A shortest path is the shortest (or least 'cost' path) from a source node (origin) to a destination node.  In practice, pathfinding seeks the shortest or most efficient way to visit a sequence of locations.

A tour is an enclosed path, that is, the first node and the final node on the path are the same node on the network.

A stop is a location visited  in a path or a tour.

Events or locations may be viewed as collection points (e.g., 'origins' or 'destinations' ) where certain resources are supplied or consumed.

A turn on a network is the transition from one arc to another arc at a node (there are 16 ways in which two intersecting roads can allow vehicle flow among the 4 links that 'connect' to the one node).

'Location-allocation' models often use network representation of connected places in order to determine the optimal locations for a given number of facilities (e.g., stores, restaurants, banks, factories, warehouses, libraries, hospitals, post offices, and schools) based on some criteria, assign people to the the 'nearest' facility.


Optional network analysis lab exercise (lab9_network written for old ArcView)


Reference for further information about GIS and networks:

         Source: http://www.ncgia.ucsb.edu/giscc/units/u064/


Terrain Modeling and 3-Dimensional Visualization in ArcGIS

  • We need more that simple mashup overlays to do spatial analysis
    • ArcGIS has many such capabilities - but we need to get deeper into data structures and interfaces
    • Let's exam and illustrate some capabilities for representing surfaces and extruded heights
  • Representing height (Z)
    • Contour lines (each line is the locus of points at a constant elevation)
    • Surface models (2.5D)
      • DEM - digital elevation models (e.g., matrix of 30m elevations)
      • TIN - triangulated irregular network
        • approximate a smooth surface using interconnected triangles
        • quick visualization by shading triangles based on slope and aspect
      • Building a TIN from contour lines or DEM
      • Computing slope and aspect
    • 3D models
      • Add Z to points, lines, polygons
      • Add surfaces and volumes as objects defined by a collection of planar polygons
      • Recognize difference between extruding 2-D shapes and allowing sloped roofs with overhang
      • ArcGIS does *not* support solid modeling (as in Google Sketchup)
        • describe objects such as cylinders and spheres by continuous math functions
        • use computational geometry to handle intersections, differencing, etc.
  • 3D visualization - ArcScene and ArcGlobe
    • Example TIN model (for Boston)
      • M:\data\bostin\hpy_bos_t contains the TIN model
      • TIN was developed using ArcGIS from elevation (hypsography) data from USGS
      • Add 3D-Analyst extension for additional capabilities in ArcMap
      • Can use ArcGlobe to view 3D data
    • Surface analyses for: contour lines, slope and aspect estimates, hillshading
    • Using slope/aspect or hillshading for visualization and analysis
      • Darken as if lighted from northeast corner
      • Find all the south-facing roads
    • Draping layers on top of TIN: base heights, z-exaggeration, offset, ..

Last modified 24 November 2010 [jf].
Back to the 11.520 Home Page.

Back to the CRON Home Page.