As indicated in Lab #6, 'Scenario 360' is part of a modeling tool called Community Viz that is a substantial 'extension' to ArcGIS and that was orginally financed by the Orton Foundation. Community Viz is a little like Model Builder. That is, you use it to develop a sequence of ArcGIS spatial data processing steps that model changes to the built environment and urban activities. However, Community Viz goes further than Model Builder in providing analytic formulas for modeling complex interactions and wizards and tools to help in building and running the model. Community Viz also focuses on scenario modeling - that is, playing out the long term consequences of growth and development in the face of various constraints and interactions regarding land use, accessibility, environmental constraints, and the like.
The ongoing MetroFuture regional planning effort for metro Boston has been using Community Viz to model Boston devleopment out to 2030. The Metropolitan Area Planning Council (MAPC) is the organization that has built the MetroFuture model. We have their model but cannot currently run Community Viz on Windows-7 with ArcGIS 10.
Here are the 6 steps from Lab #6 regarding our exploration of Community Viz using the tutorials and the MetroFuture model for Boston.
(1) Skim the scenario 360 tutorial in the 'proj11' portion of the class locker: "K:\proj11\metrofuture\Scenario_360_Tutorials.pdf"
(2) Read the Your Guide to "Winds of Change" document in the class locker: K:\proj11\metrofuture\explore_scenario_woc.pdf This document explains one of the four scenarios that MetroFuture modeled using Community Viz. The 'indicators' and 'drivers' on the last few pages are the assumptions and key relationships in the Community Viz model that explain the results of modeling the effects of a 'winds of change' strategy for metro Boston growth out to 2030.
(3) * Since the MetroFuture model is quite complex, start first with one of the Community Viz 'tutorial examples'. BEFORE RUNNING ANY COMMUNITY VIZ MODEL, be sure to copy the entire CVFiles directory tree to a local, writeable drive.
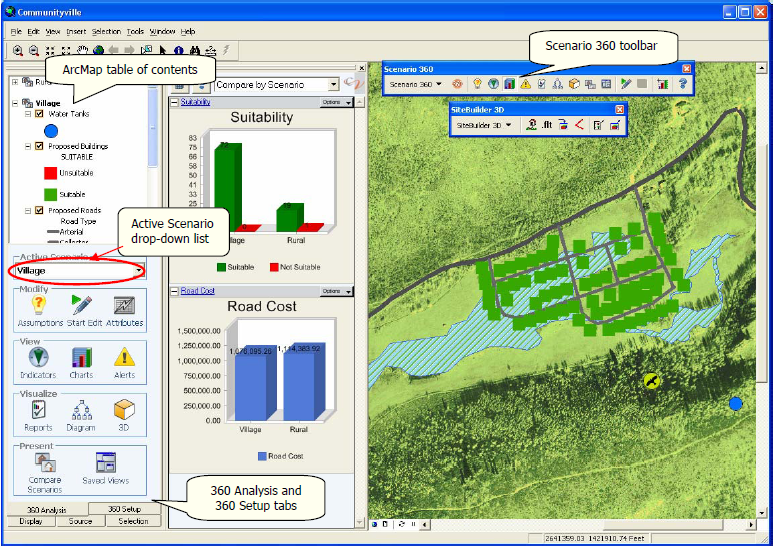
(4) * Start Community Viz - Scenario 360 from the Start/Community-Viz/Scenario-360 menu on the WinAthena PC. Once ArcGIS comes up, you will see a new toolbar for scenario-360 and a dialog box asking you to choose the saved analysis you would like to open. Browse to your local copy of Communityville and select it. You will end up with an ArcMap window something like the one below:
Note the new icons that appear in the panel on the left. In order to see the Scenario 360 toolbar, you may need to turn on th Scenario 360 toolbar in the View/Toolbars and Tools/Customize
The Communityville model calculates and visualizes the buildout that would be allowed for a hypothetical subdivision depending upon the zoning and environmental constraints that are imposed. Rerun the model after adjusting the assumption about minimum distance from the 'bird nest'. Note the reduction in allowed development that is computed and displayed as the distance-from-nest assumption is adjusted. Explore the diagram and formulas that codify the spatial and mathematical relationships.
(5) * If Start/Community-Viz is missing, you may need to reboot the machine. Also, after Communityville has been opened inside of ArcGIS, you may see a message indicating that ChartFX is not working. In this case, exit from ArcGIS since CommunityViz will not work. The machine needs to run an 'msi' installation file in: C:\Program Files\CommunityViz\Scenario 360\ChartFX\ChartFX.msi Unfortunately, you do not have permission to run this file (otherwise you could just double-click on the file to run it.) Depending upon the order of consideration of bootup files, these charting tools occasionally do not work. If you reboot the machine, the 'msi' file may get run properly during the bootup. After running ChartFX.msi, go back to step (4) to restart CommunityViz.
(6) * To run the MetroFuture model, copy the entire directory: K:\proj08\CVFiles_metro to a local, writeable directory. Then start CommunityViz as before (or start ArcGIS, make sure the CommunityViz extension is loaded and viewable, and choose scenario-360/analysis to browse to your local MetroFuture_BCCS_may2007 location).
(7) * Explore the effects of changing some of the assumptions for water or type of housing. (Rerunning the model after you have changed these assumptions takes some time, but much less than changes in many other assumptions.)
* The CommunityViz extension to ArcGIS is not currently installed on any CRON machines. These steps are indicated to give you a sense of how one runs the model with ArcMap after installing the Community Viz software.
The MetroFuture Community Viz model
- Shapefile of Traffic Analysis Zone (TAZ) level results for the
'winds of change' scenario
- We used the TAZ shapefile and select MetroFuture scenario results in the exam
- 2727 TAZ and 164 municipalities within metro Boston (out to second ring road, I-495)
- K:\metroboston\mapc\shapefiles\taz2727_loaded.shp -- fully loaded for 'winds of change'
- Examine attribute table
- MAPC slides explaining MetroFuture model:
- MetroFutureScenarioModeling_040208.ppt
- Interesting visualization of alternative growth scenarios
(beware - 100+ MB)
- MetroFuture_may2007_BCCS_FINAL - alas, no longer online
- Read the Your Guide to "Winds of Change" document in the class locker: K:\proj11\metrofuture\explore_scenario_woc.pdf This document explains one of the four scenarios that MetroFuture models using Community Viz. The 'indicators' and 'drivers' on the last few pages are the assumptions and key relationships in the Community Viz model that explain the results of modeling the effects of a 'winds of change' strategy for metro Boston growth out to 2030.
The "Future Urban Mobility" project in Singapore
- SMART Centre (Singapore/MIT Alliance for Research and Technology)
- SimMobility - agent-based microsimulation of land use and
transportation interactions
- Long, medium, and short-term modules
- Overview of long-term model: Poster from January, 2012, workshop
- Show 'one day of Singapore activities' video clip
- in .\singapore\context\sg_weekday.mov but not publicly accessible