 |
|||||
 |
 |
 |
 |
 |
 |
Images
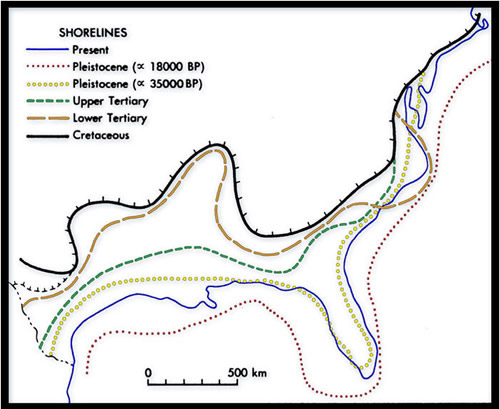
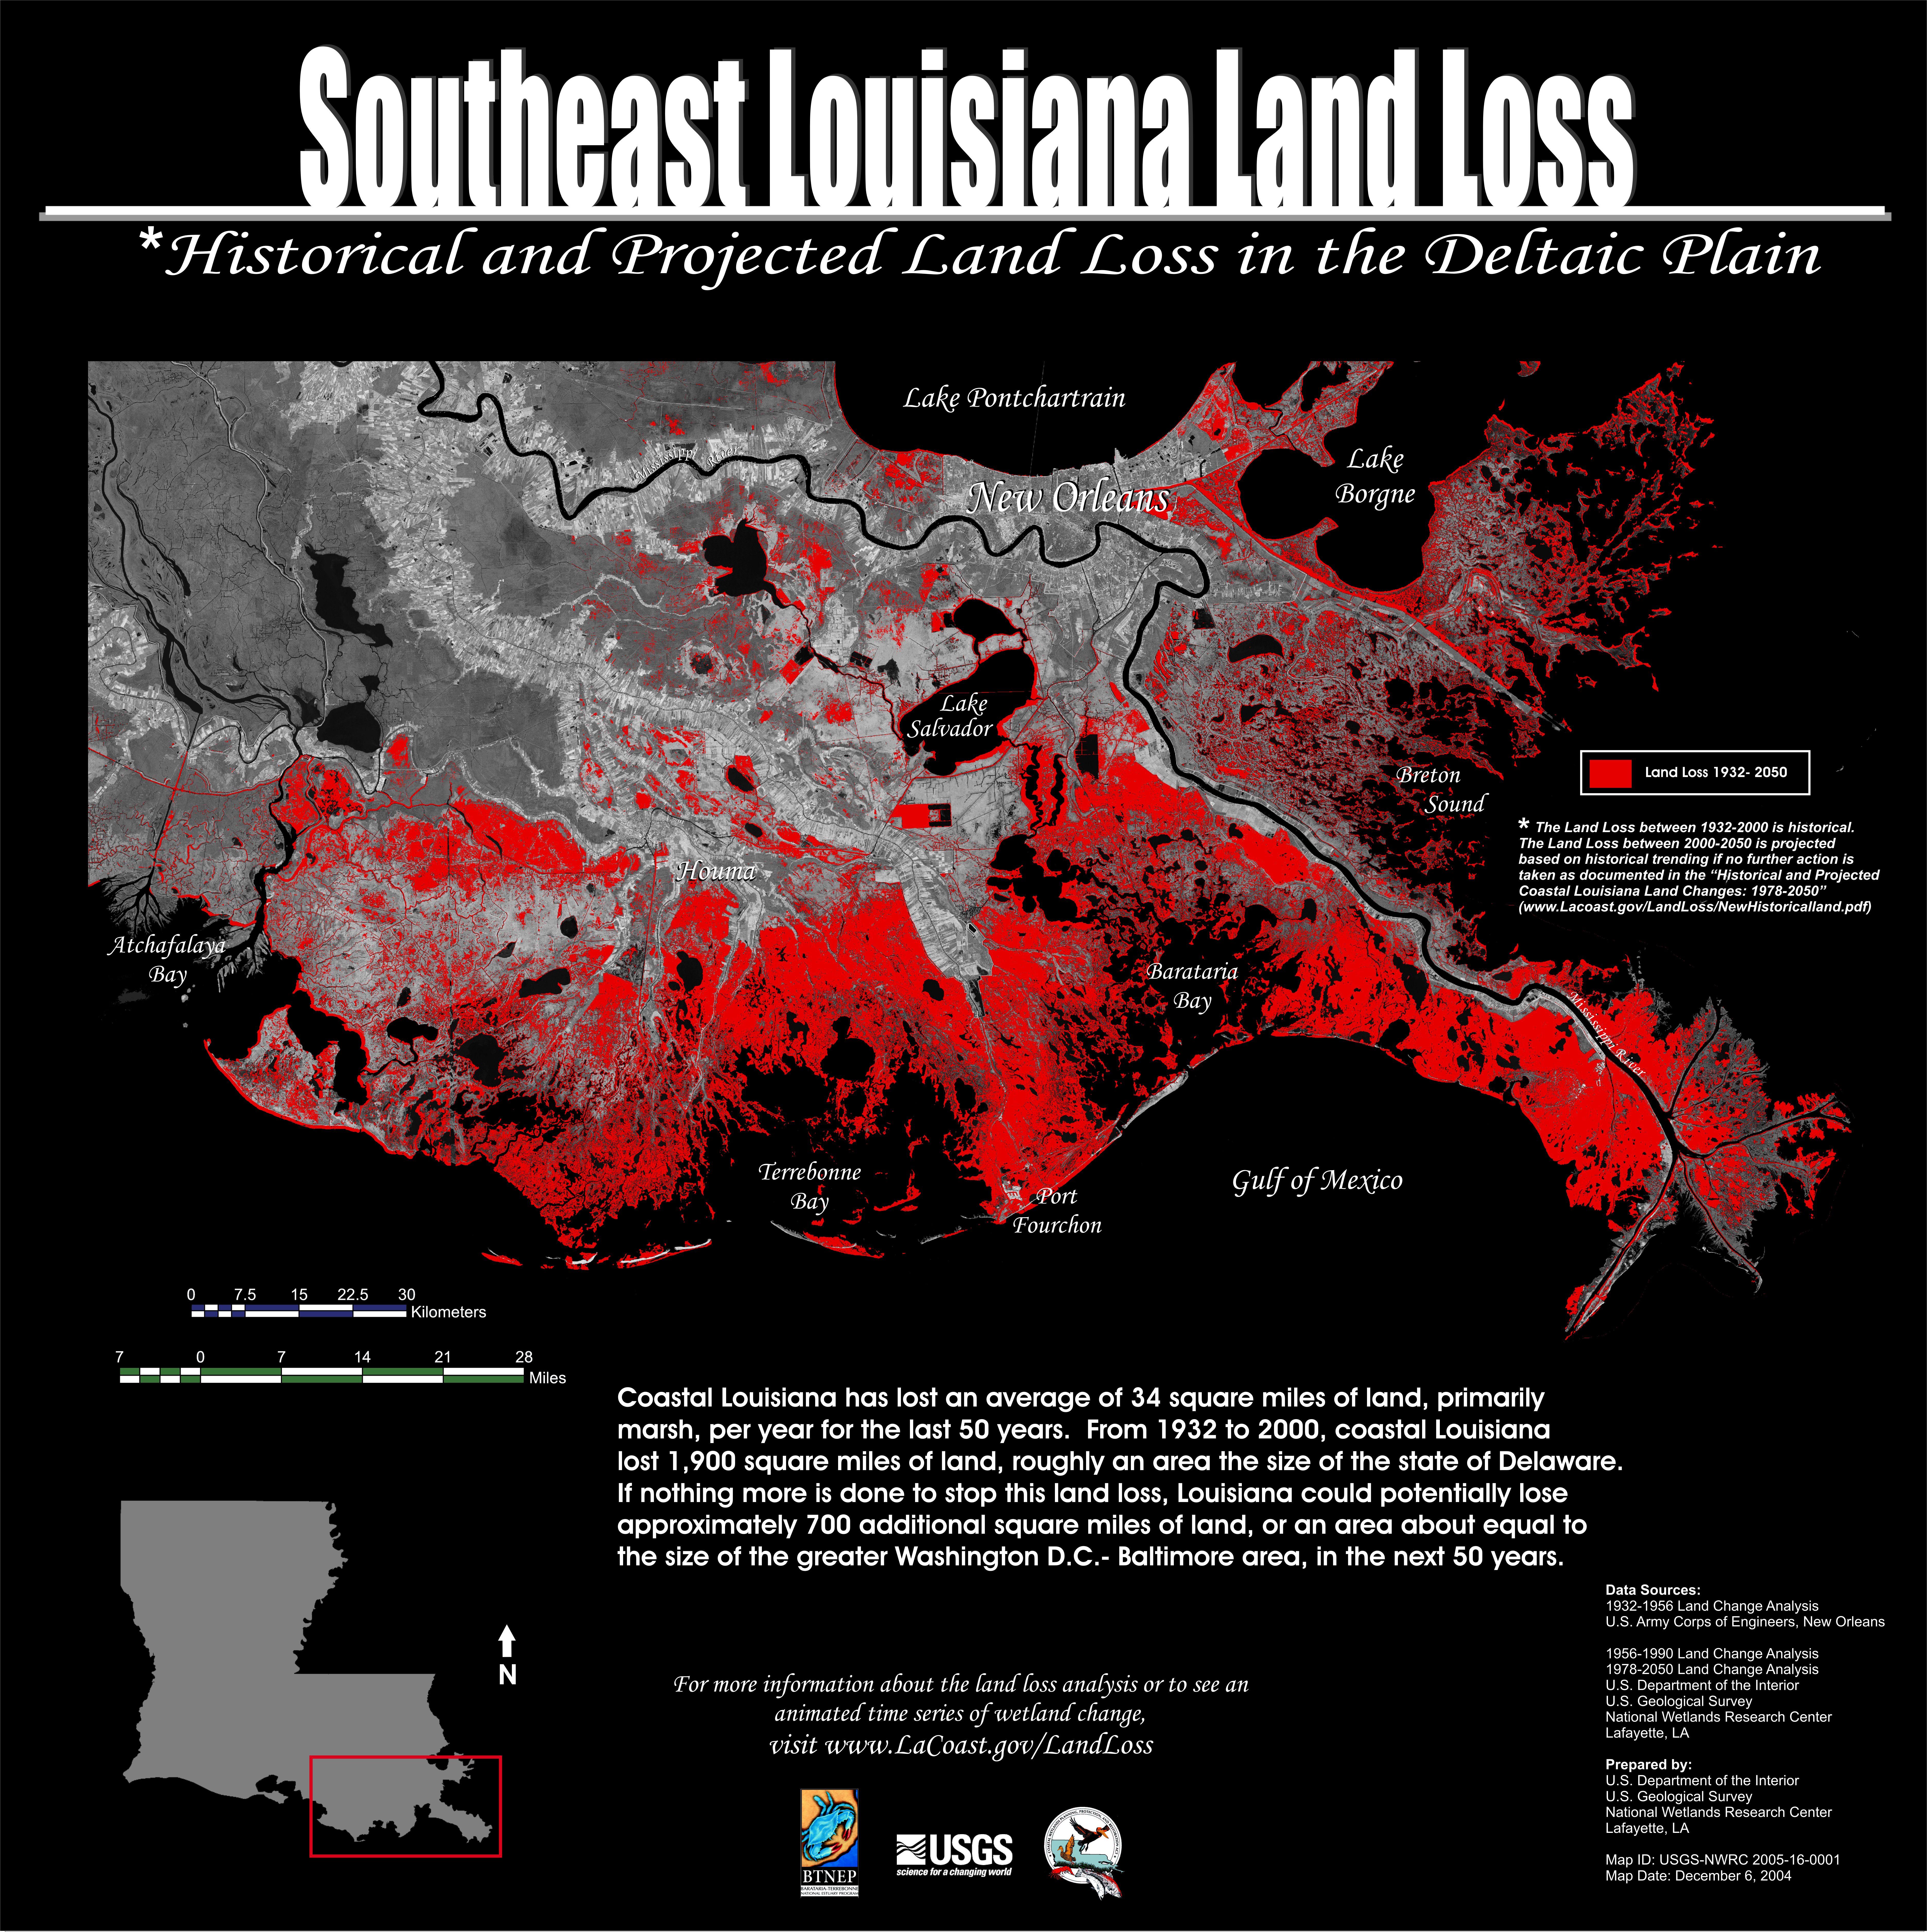
These maps, graphs, and diagrams are useful in helping to illustrate the history of the Mississippi and our plans for its future. (click for larger versions)


Images |
|||||||||||||||
These maps, graphs, and diagrams are useful in helping to illustrate the history of the Mississippi and our plans for its future. (click for larger versions)
|
|||||||||||||||
|
|
|||||||||||||||