Purpose
Experiment Description
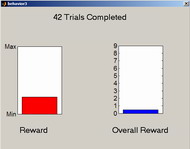
Prior to beginning the experiment, the subjects were given the following instructions.
Instructions for the experiment
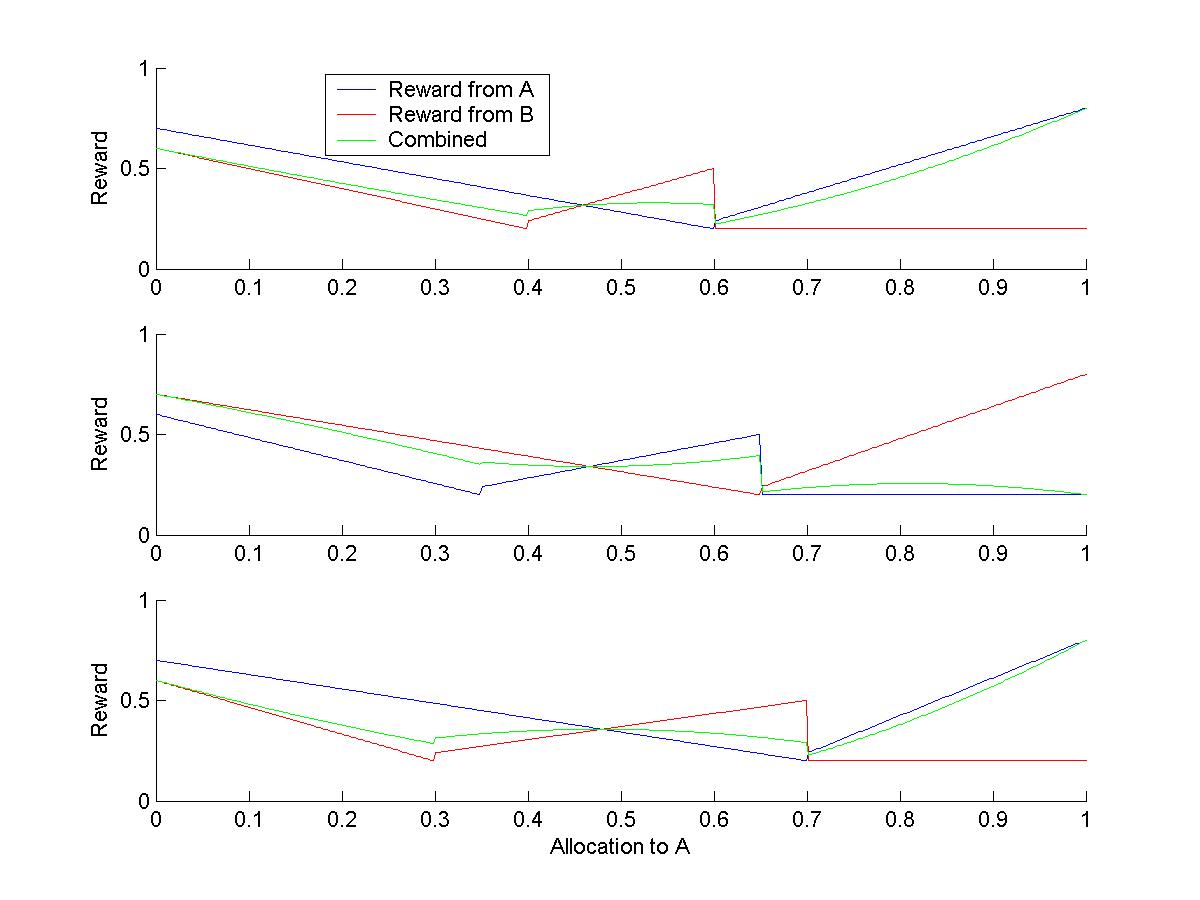
Each subjects participated in three different tasks, each of which consisted of 240 choices (or trials). The rewards for each choice were calculated based on the reward curves in Figure 2 and the previous 40 button presses.
Results and Collected Data
Data collection was performed in two phases. The first phase corresponded to the preliminary study, in which motivation was found to be a problem. The second phase corresponded to the second experiment, in which the interface was changed. The matlab data files corresponding to the subject choices and rewards are included in the corresponding .mat files. In each file, the following variables are present:
| Var Name | Dimensions | Description |
| c1 | num_trials x num_subjects | choices corresponding to subjects that performed task 1 in forward order |
| c1r | "" | choices corresponding to subjects that performed task 1 in reverse order |
| c2 | "" | choices corresponding to subjects that performed task 2 in forward order |
| ... | ... | ... |
| r1 | "" | rewards vectors corresponding to choices from c1 |
| r1r | "" | rewards vectors corresponding to choices from c1r |
| ... | ... | ... |
In the first phase, fifteen subjects were tested, with eight subjects performing the tasks in forward order (1, 2, 3), and seven subjects performing the tasks in reverse order (3,2,1).
Modeling Approaches
Each pair of group members created a model to predict how the subjects would play the game.
| Group Members | Project Title |
| Amy and Helen |
Modeling of behavior based on reward history and personal risk factor |
| Christine and Alex | Statistical modeling of user switching behavior based on reward histories |
| Shaun and Jon | Transition Differential Summation Model |
Presentations
Here are the Powerpoint slides for our class presentations:
Matlab Code