July-September 1998 Issue
Coal-Mining Productivity: National Aggregates Conceal Differences

July-September 1998 Issue
Coal-Mining Productivity: National Aggregates Conceal Differences
![]() ational statistics on coal-mining productivity show that--except
during the 1970s--coal mines have become steadily more efficient. More coal
is removed per hour of work, causing a drop in both mining costs and coal
prices. However, a new Energy Laboratory study suggests that those national
statistics do not tell the whole story. When the researchers analyzed
productivity data for more than nineteen thousand mines from 1972 through
1995, they found that some regions and some technologies lagged far behind
others. Thus, while western longwall mines were five times more productive
in 1995 than in 1972, other types of mines improved by less than half as
much--a discrepancy lost in the nationally aggregated data. Detailed
analyses of why productivity changed brought some unexpected results. For
example, even after accounting for geology and technology, bigger mines
were more productive than smaller ones. And prices affect the national
aggregates. When coal prices increase relative to labor prices, companies
open smaller mines with less favorable geology and overall productivity
drops. Indeed, according to the analysis, price increases were more
important than new regulations in causing overall productivity to plummet
in the 1970s. The study shows that aggregated national productivity data do
not provide an accurate picture of the efficiency with which an industry
uses its resources or of the causes of changes in overall productivity.
ational statistics on coal-mining productivity show that--except
during the 1970s--coal mines have become steadily more efficient. More coal
is removed per hour of work, causing a drop in both mining costs and coal
prices. However, a new Energy Laboratory study suggests that those national
statistics do not tell the whole story. When the researchers analyzed
productivity data for more than nineteen thousand mines from 1972 through
1995, they found that some regions and some technologies lagged far behind
others. Thus, while western longwall mines were five times more productive
in 1995 than in 1972, other types of mines improved by less than half as
much--a discrepancy lost in the nationally aggregated data. Detailed
analyses of why productivity changed brought some unexpected results. For
example, even after accounting for geology and technology, bigger mines
were more productive than smaller ones. And prices affect the national
aggregates. When coal prices increase relative to labor prices, companies
open smaller mines with less favorable geology and overall productivity
drops. Indeed, according to the analysis, price increases were more
important than new regulations in causing overall productivity to plummet
in the 1970s. The study shows that aggregated national productivity data do
not provide an accurate picture of the efficiency with which an industry
uses its resources or of the causes of changes in overall productivity.
Coal plays an important role in our national well-being: it provides more than a fifth of the energy and half of the electricity consumed in the United States. Much attention therefore focuses on coal-mining productivity: how much coal can be mined for each hour of labor spent? The higher the coal output per hour, the more efficient our use of human and other resources, the lower the cost of mining, and the lower the price of coal.
For the past two years, Dr. A. Denny Ellerman and Professors Thomas M. Stoker and Ernst R. Berndt have been working to understand what determines the labor productivity of coal mining. Historical trends in coal-mining productivity are intriguing. For many decades, productivity steadily increased and prices gradually declined. Then during the 1970s productivity dropped significantly while coal prices rose sharply. By the 1980s prices were again declining and productivity was rising, now at a more rapid pace. Throughout those decades, the total amount of coal mined nationwide rose steadily. What factors were responsible for those trends in productivity?
Studies of productivity in a given industry are generally based on nationwide statistics. Data are aggregated such that a single number represents productivity at all plants, mines, or factories in a given year. But if the individual plants, mines, or factories differ much, they may not be well represented by that aggregate. And coal mines do differ, dramatically. At some mines, the geology is favorable and the coal is easy to remove. At others, the coal is less accessible. Some mines occur at the surface, others underground. And different mines use different types of equipment. Given such variation in individual mines, aggregate productivity data for coal mining--based on total coal produced for total hours spent at all mines--is hard to interpret. For example, if aggregate productivity goes up, are all mines in the group really improving? Or might less productive mines be shutting down and more productive mines be opening up?In their study, the MIT researchers were able to unravel the characteristics and behavior of the individual mines represented by the aggregate productivity data. The key was an unusually detailed data set. Since 1972, the Mine Safety and Health Administration has collected mine-by-mine data on coal output and labor input as well as location, operator identity, and mining technique.
Based on quarterly data, the researchers assembled annual data on coal output and labor input for 19,098 mines from 1972 through 1995. They converted all the output data from tons of coal to Btu--a more meaningful productivity measure, as the heat content of various coals differs considerably. They then sorted mines with similar geography, geology, and technology into eleven groups. One group, for example, includes underground Appalachian mines that use continuous mining technology. Another group includes interior surface mines. Finally, the researchers calculated productivity data for each group based on the total Btu produced and the total hours spent at all mines in that group. Those "subaggregates" should be more meaningful than the conventional national aggregrate because they describe relatively homogeneous groups of mines.
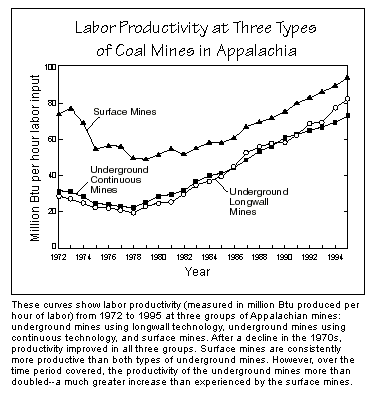
As expected, productivity levels for the eleven groups differ both in value and in how they behave over time. For example, the curves below show results for the three groups of Appalachian mines: underground mines using continuous technology, underground mines using longwall technology, and surface mines. The surface mines are consistently more productive than the underground mines are--a comparison that holds nationally through almost all of the period covered. One group of surface mines--those in the Powder River Basin (PRB) of Montana and Wyoming--is in a class by itself due to its remarkable geology. In 1995, the PRB group produced about 505 million Btu per labor hour--three times more than the next highest group.

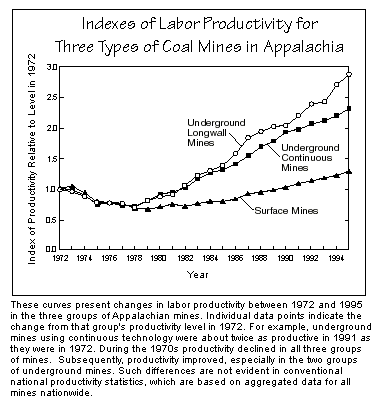
While such comparisons are interesting, the researchers' main focus has been on how productivity changes over time and why. Analysis of their new productivity data shows that the rates at which productivity increased or decreased differ substantially among the eleven groups. The figure below shows data for the three Appalachian groups. The plotted points represent indexes of productivity change, specifically, productivity in a given year divided by its level in 1972. According to the curves, productivity gradually declined in all three groups of Appalachian mines during most of the 1970s. In the late 1970s, it began to improve. However, it improved far more in underground mines than in surface mines; and underground mines using longwall technology improved more than those using continuous technology. (Keep in mind that, while the underground mines improved more, the surface mines still had higher absolute levels of productivity.)

Data for the rest of the nation show a similar discrepancy between surface and underground mines. Again, longwall underground mines show the greatest improvement, with western longwall mines doing best. Productivity for the western longwall group was fully five times greater in 1995 than in 1972--almost twice the growth in productivity of any other group. Region-to-region differences are also apparent. In general, western mines improved more than Appalachian mines and Appalachian mines more than interior mines. Such insights cannot be gleaned from national data on productivity.
To explore the causes of past changes in productivity, the researchers used special econometric techniques to analyze data for the individual mines within each group. They identified and quantified four factors that influence the level of productivity and together explain why it changes over time.
Scale effects: Productivity depends strongly on a mine's level of annual output. Bigger mines tend to be more productive than smaller ones are, regardless of mining technique or geology. Economies of scale are ubiquitous and substantial--a finding not discernible in the researchers' previous work at the industry-wide level.
Fixed effects: Certain fixed characteristics of a mine strongly influence how productive the mine is. Most important are the geology--the width, length, and slope of the coal seam and its accessibility--and the type of equipment installed. (As described above, scale is treated separately.) The impact of such characteristics on a single mine's productivity does not change over time. A mine with favorable geology will always be more productive than a mine with less favorable geology (assuming all else is equal). Because mines open and close over time, the impact of fixed effects on the subaggregate for a given group will change from year to year. When new mines with better coal seams or more advanced equipment begin operating, the fixed-effects factor pushes productivity up for that year. But the impact is not always upward. For example, sometimes less-favorable mines push out more-favorable ones because the former are close to less-expensive transportation.
Price effects: The third important factor influencing productivity is the relationship between the price of labor (the wage rate) and the price of coal. That relationship changes over time and influences which mines operate in a given year. An increase in the price of coal relative to the price of labor leads to the opening of additional mines--typically less-productive, less-economic ones. As a result, overall productivity goes down. A decrease in coal prices tends to push out the least productive mines, and overall productivity goes up.
Residual time effects: According to the econometric analysis, the three factors cited above are responsible for most of the observed change in productivity. The rest of the change is caused by several hard-to-quantify factors that change over time and affect all mines. One is resource depletion. As a mine gets older, less-accessible seams have to be exploited and productivity declines. At the same time, techniques and equipment constantly improve, causing productivity to go up. Productivity can also decline due to the imposition of new regulations, for example, requiring land reclamation or additional environmental or health controls.
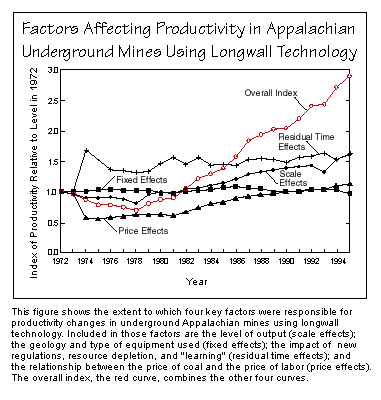
Based on their mine-by-mine findings, the researchers calculated how much each of those four factors contributed to the observed changes in productivity for the eleven groups of mines. Sample results for one group--Appalachian underground mines using longwall technology--are shown in the figure below. The black curves show the impact on productivity of each of the four factors: scale, fixed, price, and residual time effects. Taken together, those effects yield the red productivity curve for that group (the same curve that appears in the figure above).

Combining similar analyses for all eleven groups provides new insight into the causes of the decline in productivity of the 1970s. The conventional explanation is that productivity dropped because of new health, safety, and environmental regulations that were implemented during that period. However, according to the analysis of the eleven groups, prices had an even greater negative impact on productivity. The price of coal relative to the price of labor increased sharply during the 1970s for all regions. As a result, lower-quality geological formations began to be mined and smaller mines opened, pushing productivity down. Equipment continued to improve, but not enough to offset the downward influence of the other effects. Regulations appear to have had a greater effect on surface mines than on underground mines in the years after 1972.
The upturn and subsequent rapid increase in productivity in the 1980s are largely explained by the declining price of coal relative to the price of labor, the closing of less-productive mines, and the opening of larger mines, as well as continuing technological improvement. The process of implementing the new regulations came to an end, and the resulting negative effects on productivity gradually lessened.
The coal-mining study demonstrates the potential difficulties involved in interpreting conventional aggregated productivity data for any industry. If firms, factories, or other units that make up the industry differ substantially in character and behavior, aggregated data can be misleading. And if those units do not compete with one another, the picture is even muddier. During the 1970s, high-productivity western mines increased output at a greater rate than did lower-productivity eastern mines. That shift was not the result of competition--of more-efficient mines capturing market share from less-efficient ones. Instead, it occurred simply because people were moving to the regions served by these mines, the west and the southwest. Thus, aggregate productivity increased because demand changed--not a meaningful gain in the efficiency with which we use our national resources. Clearly, productivity data at all levels must be handled with care.
A. Denny Ellerman is a senior lecturer in the Sloan School of Management and executive director of the Center for Energy and Environmental Policy Research. Thomas M. Stoker is the Gordon Y Billard Professor of Applied Economics. Ernst R. Berndt is the Louis E. Seley Professor of Applied Economics. This research was supported by the Center for Energy and Environmental Policy Research. Further information can be found in reference 1 (on-line at <http://web.mit.edu/ceepr/www/wpabstracts.html#1998:>).