| Vol.
XIX No.
3 January 2007 |
| contents |
| Printable Version |
Sixty-six Years of Sponsored Research
A few years ago, MIT’s total sponsored research volume first crossed the $1 billion mark. For FY2006, research expenditures on campus totaled $587.5 million, while research expenditures at Lincoln Laboratory for the same period were $636 million, for a total of $1.2 billion. (Not included in these numbers are expenditures for research conducted by MIT faculty at Whitehead Institute, Woods Hole Oceanographic Institute, the National Bureau of Economic Research, or research funded by Howard Hughes Medical Institute.) In FY2006, Campus and Lincoln Laboratory research revenues made up almost 57% of MIT’s total operating revenues. To put this in perspective, in FY1957 MIT’s total research expenditures of $54 million represented 72% of MIT’s $75.2 million total operating expenditures.
This article presents some long-term trends in sponsored research funding and a few of the more recent challenges.
Sponsored Research Historically
M.I.T. Numbers records the changes in total MIT sponsored research over the past 66 years, in both real and inflation corrected dollars (the correction relies on the federal consumer price index, which almost surely underestimates the effective inflation rate for research). The onset of substantial, external research funding at MIT began in 1940, as the U.S. government responded to the outbreak of war in Europe (in two years, research funding increased from $105,000 to $5.2M). The most precipitous downturns occurred following the closing of the Radiation Laboratory at the end of World War II and after the divestiture of Draper Laboratory in the 1970s.
The biggest and most sustained increase, lasting nearly two decades, coincided with the Cold War period and includes the founding of Lincoln Laboratory.
The 1990 post-Cold War era saw stagnation in federal funding for MIT Lincoln Laboratory and for some areas of physical science and engineering research on campus, while inflation continued to erode the purchasing power of research dollars. There was an additional small downturn during that decade related to a decline in faculty size following an early retirement program (designed to help the Institute cope with the elimination of mandatory retirement by federal law). The dip in the early 1970s coincided with the so-called Mansfield amendment, which put restrictions on non-military funding by the Department of Defense.
In the past few years, both campus and Lincoln Laboratory have seen increases in research volume. The growth in on-campus research is due to the founding of the Broad Institute – other on-campus research has been roughly constant for the past four years. As the M.I.T. Numbers graph shows, the total 2006 research volume is slightly below that of 2005, after correction for inflation.
Sources of Research Support
In FY1957, federal support of research on campus comprised 89% of the total. During the 1990s and through 2003, the percentage of federal support decreased to ~ 75%; in FY2006 it was up slightly to 79%.
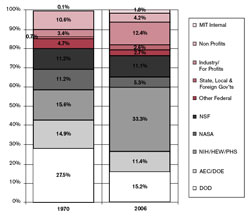
Within the category of federal support, there have been dramatic, long-term changes in the mix of sponsors (see Figure 1). Focusing on the last 35 years, in Fiscal Year 1970 the largest sponsor of on-campus research was the Department of Defense, which accounted for 28% of research expenditures, while the group of sponsors that is now Health and Human Services funded 16%. In 2006 this ranking was reversed: HHS sponsored 33% of all research on campus and the DOD’s share had dropped to 15%. The percentages for several other agencies that fund primarily physical science and engineering research also declined, such as NASA (from 11% to 5%) and the Department of Energy (formerly the Atomic Energy Commission, from 15% to 11%), while the National Science Foundation held steady at 11%. These changes largely mirror well-known national trends, in which the NIH research budget doubled (and then stagnated) while those of other agencies declined or remained roughly flat.
Within the non-federal arena, there has been a trade-off in the relative importance of non-profit (foundation) and industrial sponsorship. Between 1970 and 2006 the foundation percentage declined from 10% to 4%, while industrial sponsorship grew from 3% to 13%. The contribution from state, local, and foreign governments, while small, more than tripled, from 0.7% to 2.6%.
| Back to top |
Research Volume and the Number of Researchers
It is interesting to compare the overall volume of research on campus with the number of faculty, graduate students, and other research staff. In 1940, MIT’s faculty numbered just under 300 and in 2006 it numbered almost 1,000. In 1940, MIT had 721 matriculating graduate students and at most a handful of research staff, while in 2006 there were over 6,000 graduate students and 2400 research staff (including postdocs and all ranks of research scientist/engineer). As noted above, the decline in faculty size due to the early retirement incentive of 1997 is correlated with a decline in the research volume.
(click on image to enlarge)
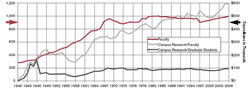
Figure 2 shows research expenditures (in constant dollars) normalized by the number of faculty, and separately by the number of graduate students. While there has been a slow, continual increase in the research volume per faculty member, the expenditures per graduate student have remained fairly constant since the mid 1960s. During the same period of time the number of graduate students per faculty has increased from 2.5 in 1940 to 6.2 in 2006, and the number of research staff per faculty grew from ~ 0 to 2.4. Clearly the makeup of the average research group has changed considerably over the last half-century.
A National Perspective
While MIT continues to be a leader in both the quantity and, more importantly, the quality of our research, it is instructive to put MIT’s growth into a national perspective. One interesting and somewhat surprising measure is MIT’s “market share.” MIT is one of nearly 200 research universities. We have data (compiled by the National Science Foundation) for a significant and important subset of this group, the 60 members of the Association of American Universities (AAU). While MIT’s research expenditures have grown significantly over the past 25 years (at a compound annual growth rate of 5.4% in actual dollars or 1.8% in constant dollars) they have declined overall relative to the total for this group.
Interestingly, MIT’s share of life science funding compared to AAU members has recently increased, but in engineering and physical sciences the share has declined. It will take further analysis to understand the full significance of these data, but one observation is that MIT’s fraction of federal research, excluding medical disciplines (an attempt to adjust for the absence of an MIT medical school), has remained high. We have held the top rank in this category throughout the 25-year period. Most of the higher growth of other AAU institutions has been from non-federal sources.
In the Future
The consolidated data on research expenditures presented here are, of course, shaped by a spectrum of external and internal factors. Most research funding is secured by entrepreneurial Principal Investigators responding to opportunities presented by federal agencies, industries, foundations, or other potential sponsors. Occasionally, these efforts become major Institute initiatives, such as the Broad Institute. The long-term trends presented here suggest the unsurprising lesson that, in the aggregate, this largely decentralized, entrepreneurial system is strongly influenced by external forces, such as trends in agency funding, federal priorities, and the level of industrial interest in supporting research.
For the past 60 years, MIT faculty and senior staff have helped to shape those external forces by serving on national advisory panels, testifying in Congress, and helping to write influential reports. We must continue such efforts, especially in this very challenging year (despite the fanfare of the American Competitiveness Initiative, the failure of Congress to pass most appropriations bills this fall has locked agency budgets at their FY 2006 levels). At the same time, we can also benefit by formulating collective strategies to address the current realities and to coordinate our attempts to change them. With the backing of the President and Provost, the Office of the Vice President for Research and MIT’s Washington Office have begun to work with groups of faculty and others toward these goals. I welcome your input.
I am grateful to Lydia Snover for helping to compile the data in this report, and to William Bonvillian for helpful comments.
| Back to top | |
| Send your comments |
| home this issue archives editorial board contact us faculty website |