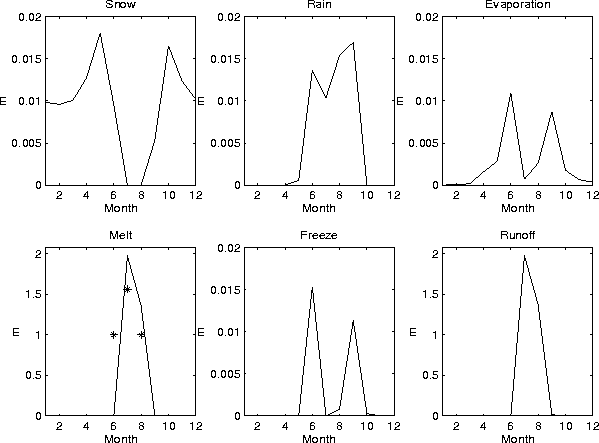
An example of the seasonal evolution of the different elements composing the local mass balance of the snow cover at Qamanârssûp Sermia produced with the MIT model input and the snowpack model is shown in Fig.9. The random variability added to the temperature distribution leads to concurrent rain- and snowfall in the spring and fall. The slight shift towards the fall of the seasonal distribution of runoff when compared to observations is due to the underestimation of the downwelling shortwave radiation by the model in June. The excess runoff in July is most likely linked to a slight overestimation of the air temperature, and thus underestimation of the albedo, during that month. The seasonal variation in the amount of meltwater which refreezes reflects the energy which is spent in the spring to bring the snowpack to the melting point and the drop in temperatures in the fall which is sufficient to refreeze part of the meltwater present within the snow. Once ice is exposed at the surface during the summer, the potential for refreezing is eliminated and the meltwater becomes runoff. The observed ablation at Qamanârssûp Sermia is 3.50 m, the MIT / snowpack model combination predicts 3.21 m. The average summer temperature at that station is 5.4oC, which leads the linear model to predict 3.56 m of ablation. There are four months with temperatures above the melting point, for a total of 527 positive degree-days. Only 19 PDD's are necessary to melt the winter's snowfall, the remainder is used to melt ice for a total runoff of 4 m.
 |
The runoff predicted by the six model combinations is compared, in Table 3, to observations at the few stations which provide that information. The MIT model combined with the snowpack or the PDD model provides the best estimates of ablation in the Southern two-thirds of the ice sheet (first four stations on the list). The underestimation of runoff at ETH Camp is linked to the downwelling shortwave radiation being slightly too small, the excess runoff at Nordbogletscher is due to the model's mid-summer air temperatures being slightly too warm. The largest discrepancies between these two model combinations occurs at Camp 4 and the absence of ablation measurements at that station does not allow any inferences from this difference. One can however expect the models to diverge for average summer temperatures higher than those experienced at these four stations: While the runoff predicted by the PDD model grows linearly as summer temperatures increase, the amount of meltwater generated by the snowpack model is a function of the surface energy balance. The latter has a much weaker dependence on the air temperature once the winter's snow is melted and ice is exposed at the surface.
| ||||||||||||||||||||||||||||||||||||||||||||||||||||||||||||||||
The equilibrium line - the elevation at which annual accumulation and ablation are balanced - is placed at approximately the correct elevation by the MIT-PDD/snowpack model combinations, near ETH Camp and Camp 4 EGIG in Greenland and off the coast in Antarctica. Regional variations in climate such as those distinguishing Nordbogletscher and Qamanârssûp Sermia, which are responsible for the difference in ablation between those two stations are not captured by the coarse resolution of the MIT climate model.
Although refreezing is a small quantity in the example shown in Fig.9 for Qamanârssûp Sermia, it plays an important role near the equilibrium line of the Greenland ice sheet, for example at Camp 4 EGIG or ETH Camp, or in Antarctica. Refreezing would also be responsible for delaying the effect of the warming of air temperatures on runoff: As the melt zone expands, the firn thickness which has to be brought to the melting point before any runoff can occur increases. The bulk of the extra energy would thus go at first into forming superimposed ice layers within the firn before any runoff could begin to take place. This effect is particularly noticeable during the model spinup (which begins with a prescribed density profile which increases linearly from 320 kg m-3 at the surface to 600 kg m-3 at 15 m depth): the amount of refreezing taking place at Qamanârssûp Sermia drops from about 30 cm to it's equilibrium value of 3 cm over the 150 years of the spinup.
The MIT / linear model combination's estimates of ablation are only adequate where the average summer temperature is predicted very accurately, namely at Qamanârssûp Sermia. An error of 2oC on the climate model's part leads to a difference of 1m in the predicted ablation. This is an accuracy which regional climate predictions have yet to attain.
The ECHAM model was shown in the previous section to underestimate the surface air temperature at Nordbogletscher and Qamanârssûp Sermia, this in turn leads the melt models to underestimate the ablation. The warmer summer temperatures of the ECHAM model in the Northern half of the ice sheet induce melting and runoff at Kronprins Christian Land and Storstrømmen, which the MIT model fails to capture. While the MIT / snowpack and ECHAM / snowpack models give similar results at ETH Camp, the slightly warmer summer temperatures of the ECHAM model lead to large differences in the ablation predicted by the PDD and Linear models, which both overestimate the ablation. This discrepancy highlights the danger of relying on a single model input, temperature, to calculate runoff.