Syntax
public abstract class Jcalcomp
Description
This Jcalcomp class is a basic engineering drawing tool by usage
of Graphics. It generates user's original coordinates, contour line
graph and 3D graph.
Jcalcomp is extended from Applet class and user should make
their own class extended from Jcalcomp.
This class is named after Calcomp plotter library, which has been used
as a flatbed plotter library in FORTRAN library.
number() draw double number in arbitrary format
arrow() draw arrow in arbitrary shape and direction
axis() draw linear axis in world coordinates
Dimension() draw design dimensions with title
f_rect() draw rectangle filled forward color specified with 2 corner points
lgaxis() draw logarithm axis in world coordinates
lgscale() output converting factor from user's linear coordinates to world ones.
lgline()
draw 2D logarithm line in user's coordinate by log/log, log/linear,
and linear/log for x/y.
lline()
draw 2D line in user's coordinates by linear scale
scale() output converting factor from user's linear coordinates to world ones.
contor() draw 2D contour line in physical and virtual coordinates.
SYNTAX :
Jcalcomp(int x_dim,int y_dim,double wid,int igx0,int igy0,int igx1,int
igy1,double gx0,
double gy0)
Jcalcomp(int x_dim,int y_dim,double wid,double gx0,double gy0)
Jcalcomp(int x_dim,int y_dim)
Jcalcomp(int x_dim,int y_dim,double wid)
Jcalcomp()
DESCRIPTION : Fix 2 points specified by top-left and bottom-right corners. Corresponding world coordinate system is developed. (see Fig.1)
PARAMETERS :
x_dim
width of outer boundary dimension in screen coordinate(see
Fig.1)default=300
y_dim
height of outer boundary dimension in screen coordinate(see
Fig.1) default=200
igx0
specified top-left corner x coordinate (see Fig.1)default=0
igy0
specified top-left corner y coordinate (see Fig.1)default=0
igx1
specified bottom-right corner x coordinate (see Fig.1)default=x_dim
igy1
specified bottom-right corner y coordinate (see Fig.1)default=y_dim
gx0
origin in world x coodinate (see Fig.1)default=0.
gy0
origin in world y coodinate (see Fig.1)default=0.
wid
width corresponding to igx1-igx0 in world cordinate(see Fig.1)default=30.
RETURNS : none
SEEALSO : Vector2D class
EXAMPLE :
import java.applet.*;
import java.awt.*;
//******************************************
public class Fig001 extends Jcalcomp
//******************************************
{
//==========================================
public Fig001()
//==========================================
{
super(400,350,35.,0.,0.);
}
//==========================================
public void init()
//==========================================
{
setLayout( null );
}
//==========================================
public void paint( Graphics g )
//==========================================
{
double x0=3.,x1=20.,y0=3.,y1=25.,sun=3.;
int i;
// double dx=15.0/(double)(maxp-1);
Dimension(g,10.,20.,12.,17.,3.,4,"ABC");
g.setColor( Color.yellow );
f_rect(g,x0,y0,x1,y1);
g.setColor( Color.cyan );
f_rect(g,x0+sun,y0+sun,x1-sun,y1-sun);
g.setColor( Color.black );
Font f1=new Font("TimesRoman",Font.BOLD,12);
g.setColor( Color.black );
Dimension(g,new Vector2D(x1,y0),new Vector2D(x1,y1),-sun,4,"ABC");
Dimension(g,x0,y1,x1,y1,sun,4,"ABC");
Dimension(g,x0+sun,y0+1.5*sun,x1-sun,y0+1.5*sun,0.,4,"ABC");
u_plot(g,x0+sun,y1-sun,3);
u_plot(g,x0+1.5*sun,y1-.7*sun,2);
u_plot(g,x0+3.5*sun,y1-.7*sun,2);
u_plot(g,x1-sun,y0+sun,3);
u_plot(g,x1-1.5*sun,y0+.6*sun,2);
u_plot(g,x0+2.5*sun,y0+.6*sun,2);
u_plot(g,x0+sun,y0+sun,3);
u_plot(g,x0+1.5*sun,y0-.6*sun,2);
u_plot(g,x0+3.5*sun,y0-.6*sun,2);
marker(g,x0+sun,y1-sun,5);
marker(g,x1-sun,y0+sun,5);
marker(g,x0+sun,y0+sun,5);
g.setColor( Color.red );
symbol(g,x1+.4*sun,y0+.35*(y1-y0),1.,"y_dim",90.,5);
symbol(g,x0+.35*(x1-x0),y1+.5*sun,1.,"x_dim",0.,5);
symbol(g,x0+2.6*sun,y0+.65*sun,"(jgx1,jgy1)");
symbol(g,x0+1.5*sun,y1-.6*sun,"(jgx0,jgy0)");
g.setColor( Color.black );
symbol(g,x0+.35*(x1-x0),y0+1.6*sun,"Width");
symbol(g,x0+1.7*sun,y0-.55*sun,"(gx01,gy01)");
Font f=new Font("TimesRoman",Font.BOLD,24);
g.setFont(f);
g.setColor( Color.yellow );
}
}
PURPOSE : 2D Plotting in World Coordinates
SYNTAX :
plot(Graphics g,double x,double y,int n)
plot(Graphics g,Vector2D V,int n)
DESCRIPTION :
Pen is moving in the state of up or down
PARAMETERS :
SEEALSO : Vector2D class
EXAMPLE :see example of Jcalcomp()
SYNTAX :
public void SectionPaper(Graphics
g, double x0,double y0, double x1,double y1,
double dx, double dy, int pitch0, int pitch1)
DESCRIPTION :
PARAMETERS :
g
Graphic port
x0
a corner's x coordinate of the section paper
y0
a corner's y coordinate of the section paper
x1
opposite corner's x coordinate of the section paper
y1
opposite corner's y coordinate of the section paper
dx
minimum pitch of x-direction
dy
minimum pitch of y-direction
pitch0
fine pitch(>0) drawn in lightgray color
pitch1
rough pitch(>0) drawn in darkgray color
RETURNS : none
SEEALSO : lattice,Graphics class,Color class
EXAMPLE : see example of Jcalcomp()
SYNTAX :
public void lattice(Graphics
g, double x0,double y0, double x1,double y1, double dx, double
dy)
DESCRIPTION :
PARAMETERS :
g
Graphic port
x0
a corner's x-coordinate of the lattice
y0
a corner's y-coordinate of the latice
x1
opposite corner's x-coordinate of the lattice
y1
opposite corner's y-coordinate of the lattice
dx
pitch of x-direction
dy
pitch of y-direction
RETURNS : none
SEEALSO : SectionPaper(),Graphics class,Color class
EXAMPLE : see example of Jcalcomp()
SYNTAX :
public void
arcarrow(Graphics g, Vector2D e0, Vector2D e1,double angle,
int mode)
DESCRIPTION :
PARAMETERS :
g
Graphic port
mode
arrow drawing mode =1: no arrow; =2: one arrow at the
end; =3:one arrow at the start; =4: arrows at both end ; defalt =1
e0
=new Vectoe2D(x0,y0) center of arc
e1
=new Vectoe2D(x1,y1) start radial vector from center
angle angle
of arrow in degree
RETURNS : none
SEEALSO : Vector2D class ,Dimension() ,Graphics class,Color class
EXAMPLE :
import java.applet.*;
import java.awt.*;
import java.util.Date;
//******************************************
public class Fig050 extends Jcalcomp
//******************************************
{
//==========================================
public Fig050()
//==========================================
{
super(600,500,40.,-5.,-5.);
}
//==========================================
public void init()
//==========================================
{
}
//==========================================
public void paint(Graphics g)
//==========================================
{
g.drawString("Fig050: arcarrow",10,450);
for(int i=0;i<360;i+=30)
{
double angs=(double)i*Math.PI/180.;
for(int j=30;j<360;j+=30)
{
double ange=(double)j*Math.PI/180.;
arc_arrow(g,
new Vector2D((double)i/10.,(double)j/10.0),
new Vector2D(Math.cos(angs),Math.sin(angs)),
(double)j,(i/30)%4+1);
}
}
}
//==========================================
}
SYNTAX :
public void arrow(Graphics
g, double x0,double y0, double x1,double y1, int
mode)
public void arrow(Graphics
g, Vector2D e0, Vector2D e1, int mode)
DESCRIPTION :
PARAMETERS :
g
Graphic port
x0
arrow starting x world coordinate
y0
arrow starting y world coordinate
x1
arrow ending x world coordinate
y1
arrow starting y world coordinate
mode
arrow drawing mode =1: no arrow; =2: one arrow at the
end; =3:one arrow at the stat; =4: arrows at both end ; defalt =1
e0
=new Vectoe2D(x0,y0)
e1
=new Vectoe2D(x1,y1)
RETURNS : none
SEEALSO : Vector2D class ,Dimension() ,Graphics class,Color class
EXAMPLE : see example of Jcalcomp()
SYNTAX :
public void u_rect(Graphics
g, double x0,double y0, double x1,double y1)
DESCRIPTION :
Specified by 2 vertex( left-bottom
and right-top in world coordinates)
PARAMETERS :
g
Graphic port
x0
left-bottom x world coordinate
y0
left-bottom y world coordinate
x1
right-top x world coordinate
y1
right-top y world coordinate
RETURNS : none
SEEALSO : Vector2D class ,f_rect()
EXAMPLE : see example of Jcalcomp()
SYNTAX :
public void f_rect(Graphics
g, double x0,double y0, double x1,double y1)
DESCRIPTION :
Specified by 2 vertex( left-bottom
and right-top in world coordinates)
PARAMETERS :
g
Graphic port
x0
left-bottom x world coordinate
y0
left-bottom y world coordinate
x1
right-top x world coordinate
y1
right-top y world coordinate
RETURNS : none
SEEALSO : Vector2D class ,u_rect() ,Graphics class,Color class
EXAMPLE : see example of Jcalcomp()
SYNTAX :
public void Dimension(Graphics g,
double x0,double y0, double x1,double y1,double supl,
int mode,String title)
public void Dimension(Graphics g,
Vector2D e0, Vector2D e1,double supl,
int mode,String title)
DESCRIPTION : line parallel to specified 2 points are e0(x0,y1) and e1(x1,y1) and supplement lines start from e0 and e1 of length supl and draw title on them
PARAMETERS :
g
Graphic port
x0
arrow starting x world coordinate
y0
arrow starting y world coordinate
x1
arrow ending x world coordinate
y1
arrow starting y world coordinate
mode
arrow drawing mode =1: no arrow; =2: one arrow at the
end; =3:one arrow at the stat; =4: arrows at both end ; defalt =1
e0
=new Vectoe2D(x0,y0)
e1
=new Vectoe2D(x1,y1)
supl
length of supplemental lines which are 90 degree rotated from the vector
e0 to e1.
If supl<0, it means -90 degree rotation
title
title on the arow
RETURNS : none
SEEALSO : Vector2D class ,Dimension()
EXAMPLE : see example of Jcalcomp()
DESCRIPTION :
PARAMETERS :
SEEALSO : Vector2D class, number()
EXAMPLE : see example of Jcalcomp()
SYNTAX :
void number(Graphics g,double x,double y,double h, double fpn,double
theta,int n)
DESCRIPTION :
PARAMETERS :
SEEALSO : symbol()
import java.applet.*;
import java.awt.*;
//******************************************
public class Fig002 extends Jcalcomp
//******************************************
{
//==========================================
public Fig002()
//==========================================
{
super(400,150,35.,0.,0.);
}
//==========================================
public void init()
//==========================================
{
setLayout( null );
}
//==========================================
public void paint( Graphics g )
//==========================================
{
double fpn=1234.56789;
for(int n=4;n>-3;n--)
{
symbol(g,2.,(double)n*1.,.8,"n=",0.,2);
number(g,4.,(double)n*1.,.8, (double)n,0.,-1);
number(g,8.,(double)n*1.,.8, fpn,0.,n);
}
}
}
SYNTAX : void marker(Graphics g,double
x,double y,int n)
DESCRIPTION : The shape of markers are controlled by n.The height is preserved value h2 in class.
PARAMETERS :
x
The x coordinate of center of the marker.
y
The y coordinate of center of the marker.
n
Specify the shape of marker
0: none drawn
1: Circle
2: Square
3: none drawn
4: Filled Square
5: Filled circle
6: Filled triangle
RETURNS : none
SEEALSO : lline(),lgline()
EXAMPLE :
SYNTAX : void axis(Graphics g, double
x0,double y0,double d,double t, double theta,String title,
int n,int m,int md,double sm,double smd)
DESCRIPTION : User has to recognize the
difference between "world coordinate" and "User coordinate". This axis
method is the interface of them. x0, y0, d, and t are in world coordinate
system, and
sm and smd are in User Coordinate system.
PARAMETERS :
SEEALSO : axis(),scale(),marker()
EXAMPLE : see example of lline()
SYNTAX :
void lline(Graphics g, double xp,double yp,
double[] x,double[] y, int nn,int isym)
void lline(Graphics g, Vector2D v0,
Vector2D[] v, int nn,int isym)
DESCRIPTION :
The coordinate data set is stored in two arrays x[] and y[], respectively.
This line has some mode to differenciate it from another line. Some
symbols are able to plot on each coordinate point. The line can be
erased, when users do not need it. The color of line is foreground color,
which is not cared in this method.
PARAMETERS :
SEEALSO : axis(),scale(),marker(),lgaxis()
EXAMPLE :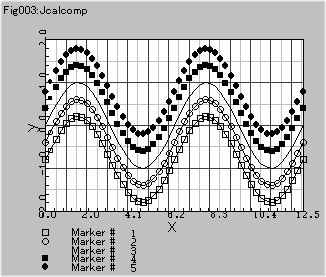
import java.applet.*;
import java.awt.*;
//******************************************
public class Fig003 extends Jcalcomp
//******************************************
{
//==========================================
public Fig003()
//==========================================
{
super(300,250,35.,-5.,-5.);
}
//==========================================
public void init()
//==========================================
{
setLayout( null );
}
//==========================================
public void paint( Graphics g )
//==========================================
{
double fpn=1234.56789;
int maxp=51;
double x[]=new double[105],y[]=new double[105];
double width=30.,height=20.,dx=width/(double)(maxp-1),
udx=dx/width*4.*Math.PI;
SectionPaper(g,0.,0.,width,height,
width/(4.*Math.PI)*.5,height/8.,1,2);
u_plot(g,0.,0.,3);u_plot(g,0.,height,2);
u_plot(g,width,height,2);u_plot(g,width,0.,2);
u_plot(g,0.,0.,2);
for(int i=0;i<=maxp;i++)
{
x[i]=udx*i;
y[i]=Math.sin(x[i]);
}
x[maxp+1]=0.; y[maxp+1]=0.;
x[maxp+2]=(4.*Math.PI)/width;
y[maxp+2]=4./height;
for(int i=1;i<=5;i++)
{
if(i<4) lline(g,0.,10.+(i-3)*2.,x,y,maxp,i);
else lline(g,0.,10.+(i-3)*2.,x,y,-maxp,i);
marker(g,0.,-2.-i*1.+.5,i);
symbol(g,3.,-2-i*1.,"Marker #");
number(g,10.,-2-i*1.,0.8,(double)i,0.,-1);
}
axis(g,0.,0.,1.,width,0.,"x",1,1,5,0.,5.*x[maxp+2]);
axis(g,0.,0.,-1.,height,90.,"y",1,1,5,-2.,5.*y[maxp+2]);
}
}
DESCRIPTION : The scale factor of linear
plotting is calculated by maximum and minimum value of x[]
between x[0] to x[n] and insert at the last of x array. x[n+1]
is mimimum and bottom of graph.
x[n+2] is scale factor of user coodinate/world coordinate. User can
calculate these two element by them selves and set by substitution of value.
PARAMETERS :
x
Array to be scaled
n
maximum number of element x to be plotted. It is not coincide to
array length.
The array length must be n+2 or over
dx
scale factor of user coodinate/world coordinate
RETURNS : none
SEEALSO : lline(),axis()
EXAMPLE : see example of lline
SYNTAX : void lgaxis(Graphics g,
double x0,double y0,double t,double theta,
int isep,String title,int n,int m)
DESCRIPTION : User have to recognize the difference between "world coordinate" and "User coordinate". This lgaxis method is the interface between them. x0, y0, and t are in world coordinate system, and 10**m and 10**(m+isep) are in User logarithm Coordinate system.
PARAMETERS :
SEEALSO : lgaxis(),lgscale(),marker()
EXAMPLE : see example of lgline()
SYNTAX :
void lglline(Graphics g, double xp,double yp,
double[] x,double[] y, int nn,int ils,int isym)
DESCRIPTION :
The coordinate data set is stored in two array x[] and y[], respectively.
This line has three styles, which are log-log, log-linear, and linear-log
in x-y plotting. multiple lines are differenceiated by marker symbols and/or
its color. Some marker symbols are be able to plot on each coordinate point.
The line can be erased, when users do not need it. The color of line is
foreground color, which is not cared in this method.
PARAMETERS :
SEEALSO : lgaxis(),lgscale(),marker(),axis()
//******************************************
public class Fig004 extends Jcalcomp
//******************************************
{
//==========================================
public Fig004()
//==========================================
{
super(600,300,75.,-5.,-8.);
}
//==========================================
public void init()
//==========================================
{
setLayout( null );
}
//==========================================
public void paint( Graphics g )
//==========================================
{
double fpn=1234.56789;
int maxp=51;
double x[]=new double[105],y[]=new double[105];
double width=30.,height=20.,dx=width/(double)(maxp-1),
udx=dx/width*4.*Math.PI;
double xmove=5.+width,ymove=-7.-height;
u_plot(g,0.,0.,3);u_plot(g,0.,height,2);
u_plot(g,width,height,2);u_plot(g,width,0.,2);
u_plot(g,0.,0.,2);
for(int i=0;i<=maxp;i++)
{
x[i]=udx*i+1.;
y[i]=2.-Math.sin(x[i]);
}
// log-log plot
x[maxp+1]=0.; y[maxp+1]=0.;
x[maxp+2]=width/2.;
y[maxp+2]=height/2.;
for(int i=1;i<=5;i++)
{
if(i<4) lgline(g,0.,10.+(i-3)*2.,x,y,maxp,1,i);
else lgline(g,0.,10.+(i-3)*2.,x,y,-maxp,1,i);
marker(g,width*.5+3.,8.-i*1.+.5,i);
symbol(g,width*.5+2.+3.,8.-i*1.,"Marker #");
number(g,width*.5+2.+10.,8.-i*1.,0.8,(double)i,0.,-1);
}
lgaxis(g,0.,0.,width,0.,2,"x(log)",6,0);
lgaxis(g,0.,0.,height,90.,-2,"y(log)",6,-1);
// log-linear plot
x[maxp+1]=0.; y[maxp+1]=0.;
x[maxp+2]=width/2.;
y[maxp+2]=1./(10./height);
for(int i=1;i<=5;i++)
{
if(i<4) lgline(g,xmove,10.+(i-3)*2.,x,y,maxp,2,i);
else lgline(g,xmove,10.+(i-3)*2.,x,y,-maxp,2,i);
}
lgaxis(g,xmove,0.,width,0.,2,"x(log)",6,0);
axis(g,xmove,0.,-1.,height,90.,"y",1,1,5,0.,5./y[maxp+2]);
u_plot(g,width+xmove,0.,3);u_plot(g,width+xmove,height,2);
u_plot(g,xmove,height,2);
// linear-log plot
x[maxp+1]=0.; y[maxp+1]=0.;
x[maxp+2]=1./((5.*Math.PI)/width);
y[maxp+2]=height/2.;
for(int i=1;i<=5;i++)
{
if(i<4) lgline(g,0.,ymove+10.+(i-3)*2.,x,y,maxp,3,i);
else lgline(g,0.,ymove+10.+(i-3)*2.,x,y,-maxp,3,i);
}
lgaxis(g,0.,ymove,height,90.,-2,"y(log)",6,0);
axis(g,0.,ymove,1.,width,0.,"x",1,1,5,0.,5./x[maxp+2]);
u_plot(g,width,ymove,3);u_plot(g,width,ymove+height,2);
u_plot(g,0.,ymove+height,2);
}
}
DESCRIPTION : The scale factor of log-log
or log-linear plotting is calculated by maximum and minimum value of x[]
between x[0] to x[n] and insert at the last of x array. x[n+1]
is mimimum and bottom of graph.
x[n+2] is scale factor of world coodinate/user coordinate. User
can calculate these two element by them selves and set by substitution
of value. The treatment of linear case is different from lline() and scale().
(see lgline())
PARAMETERS :
x
Array to be scaled
n
maximum number of element x to be plotted. It is not coincide to
array length.
The array length must be n+2 or over
dx
scale factor of user coodinate/world coordinate
RETURNS : none
SEEALSO : lgline(),lgaxis()
EXAMPLE : see example of lline
DESCRIPTION :
PARAMETERS :
SEEALSO :
EXAMPLE :
PARAMETERS :
[i][j] is specified [fdim*i+j]
m
Max of array x in target area
n
Max of array y in target area
xdim
1st dimension of Array x
ydim
1st dimension of Array y
fdim
1st dimension of Array flg
wid
size of x direction of target area in case of mod=1
hei
size of y direction of target area in case of mod=1
SEEALSO : contour()
EXAMPLE : see example of contour()
DESCRIPTION :
PARAMETERS :
SEEALSO : contour(),mshplt()
EXAMPLE : see example of contour()
SYNTAX :
void contor(Graphics g, int mod, double[] x,double[] y,double[]
f, char[] flg,double[] setlvl, int[] stclr,int[]
stlsy,int lvl,int m,int n, int xdim,int ydim,int vdim,int fdim,
double wid,double hei)
void contor(Graphics g, int mod, double[][] x2dim,double[][]
y2dim,double[][] f2dim, char[][] flg2dim,double[] setlvl,
int[] stclr,int[] stlsy,int lvl,int m,int n, double wid,double
hei)
DESCRIPTION :
Real coordinate system is specified by (x,y) and they are topologically
equal to virtual coordinate system.
Then given coordinate system by users is available in both system.
Settings of the cotour level is user's matter. Maximum of level
setting is depends upon array size of setlvl[] and setclr[].While color
levels is now fixed to a gradiation series of yellow color, user can choose
arbitrary colors in future.
PARAMETERS :
SEEALSO : fmxmn(),mshplt(),find()
EXAMPLE : 
import java.applet.*;
import java.awt.*;
//******************************************
public class Fig005 extends Jcalcomp
//******************************************
{
//==========================================
public Fig005()
//==========================================
{
super(600,300,75.,-30.,-8.);
}
//==========================================
public void init()
//==========================================
{
setLayout( null );
}
//==========================================
public void paint( Graphics g )
//==========================================
{
double n;
int i,j;
char flg[]=new char[140];
double wid=4.0;
double xcur,ycur;
double x[]= new double[140],
y[]= new double[140],
f[]= new double[140],
setlvl[]=new double[21];
int stclr[]=new int[21],
stlsy[]=new int[21];
double r0=7.,r1=30.;
double h1;
int x_max=10,y_max=10,f_max=10;
int x_max1=x_max+1,y_max1=y_max+1,f_max1=f_max+1;
g.setColor( Color.yellow );
double dx=Math.PI/x_max;
double dy=(r1-r0)/y_max;
for(i=0;i<=x_max;i++)
{
double costheta=Math.cos(dx*i);
double sintheta=Math.sin(dx*i);
for(j=0;j<=y_max;j++)
{
double r=r0+dy*j;
x[i*x_max1+j]=r*costheta;
y[i*x_max1+j]=r*sintheta;
f[i*x_max1+j]=(y[i*y_max1+j])*(1.-(r0*r0)/(r*r));
flg[i*x_max1+j]='F';
}
}
for(i=0;i<=20;i++)
{
if(i<10)setlvl[i]=(double)i;
else setlvl[i]=(double)i*2-10;
stclr[i]=i*10;
}
mshplt(g,
0,0,
x,y,flg,
x_max,y_max,x_max1,y_max1,f_max1,20.,15.);
contor(g,
-1,
x, y, f,
flg,setlvl,
stclr,stlsy,20,
x_max,y_max,
x_max1,y_max1,f_max1,f_max1,
20.,15.);
}
}
DESCRIPTION :
PARAMETERS :
RETURNS :
SEEALSO :
EXAMPLE :