Description of Problem
Rare Earth Elements (REEs) are becoming increasingly integrated in new technologies, especially within the clean energy, military, and consumer electronics sectors. As each of these sectors continues to grow, so does the industry's demand for the constituent REEs. While exact projections of demand in future years are difficult to make, analysts have placed the lower and upper bounds for annual growth for total REE demand at 5% and 9% over the next 25 years (Alonso, Sherman, Wallington, Everson, Field, Roth & Kirchain, 2012).
One of the key features of REE demand is that demand does not grow uniformly for individual REEs, but rather depends on growth in the markets for derivative products of the individual REEs. Demand for dysprosium, for example, is largely derived from demand in the clean energy sector for wind turbines and electric motors. This example is discussed in more detail in the case study section below.
Conversely, changes in supply of individual REEs often correspond to changes in the entire supply chain, due to the presence of co-mining. That is, because different rare earth oxides (REOs) do not appear in deposits separately, and thus are mined and processed together, changes in the supply of one particular REE generally reflect the change in the supply of REEs in general. As a result, we can use standard mining models to project future supply.
It is important to note that out of the 17 REEs, significant data on supply and demand is only available for the following ten elements: La, Ce, Pr, Nd, Sm, Eu, Gd, Tb, Dy, and Y (Alonso et al., 2012). Thus, our analysis only concerns members and parent oxides of these ten elements.
Current and Predicted REE Demand Levels
Current global REE demand is consistently estimated to be 105,000 tons (+/- 15%) of rare earth oxides (REOs, the main way REEs are purchased) per annum (Hatch, 2012; Alonso et al., 2012). The following chart shows the breakdown of total REE demand by end use and continent.
Global Estimates of Demand for Total Rare Earth Oxides in 2011 (+/- 15%)
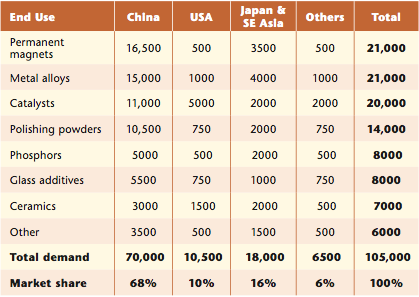
Source: Hatch, 2012
As one can see, permanent magnets, metal alloys, and catalysts are the sectors with the greatest demand for REEs. However, REE use in polishing powders also is a large portion of total REE demand. The permanent magnets sector is expected to have large growth over the next century. This is mainly due to increase demands for green energy. High-efficiency generators in turbines and electric motors require strong, yet light, permanent magnets. Currently magnets using neodymium, praseodymium, and samarium (with dysprosium and terbium additives) are the strongest and lightest that are commercially available (Hatch, 2012; Department of Energy, 2011). Assuming technology does not change significantly, large REE demand growth is expected in the permanent magnet sector. Taking expected growth in the various sectors of demand, Alonso et al. (2012) give the lower bound for average growth in total REE demand over the next 25 years at five percent per annum; the upper bound is at 8.6 percent per annum. A model assuming historical growth (for a given sector, future growth was close to historic growth rates) resulted in a 5.6% average annual growth rate. Such a growth would yield a demand of approximately 210,000 tonnes total REOs in the year 2025 (Alonso et al., 2012).
Projected Total REE Demand Growth, Assuming Historical Growth
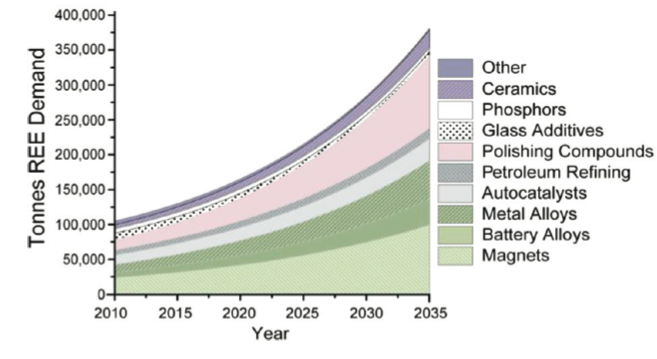
Source: Alonso et al., 2012
In addition to growth in demand for all REEs, it is important to look at demand growth for individual REEs as certain REEs will experience greater growth due the commonality of their use. As one can see in the figure above, certain sectors are predicted to undergo much greater growth than others. As has been previously discussed, the magnet sector is expected to grow greatly. REE polishing compounds are expected to see large increase in use as well.
Different demand sectors grow at different rates. However, each sector uses different REEs. This means that over time the demand of a specific REE can become a much larger (or smaller) percentage of total demand. For example, by 2035, neodymium demand may be almost 40% of total demand compared to the 20% of total demand that it is today (Alonso et al., 2012). The chart below shows fractional REE demand assuming sector growth is as predicted by industry experts. Although quite hard to see, dysprosium fractional demand greatly increases. Lanthanum and cerium both make up less of total demand over time.
Projected Fractional REE Demand Growth, Assuming Historical Growth
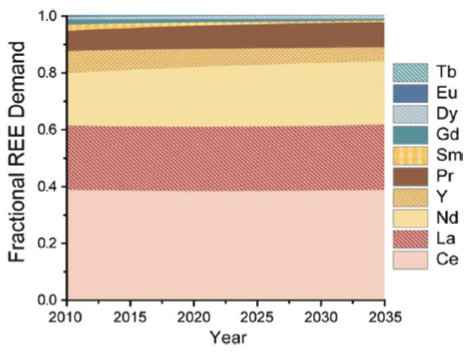
Source: Alonso et al., 2012
Current and Predicted REE Supply Levels
Current REE supply is estimated to be 113,000 tonnes of REOs (+/-15%) per annum. Thus, there currently is a surplus of REOs. In fact, total REE supply is predicted to keep up with the growth in total REE demand in the near future. Except for the highest predictions for total REE demand growth, historic supply growth is within 1% of the projected demand growth rates. This difference, while significant over large periods of time, would have very little effect in the short term (Alonso et al., 2012). In fact, there is almost no doubt that supply of REEs over the next 5-7 years will sufficiently meet demand. Projected total supply of REEs in 2015 is 200,000 tonnes of REOs per annum (Department of Energy, 2011).
Although supply is projected to remain even with demand for the next 5-7 years, net demand is projected to outstrip net supply in the longer run. As more countries become developed, their demands for technologies using REEs will increase, resulting in larger total demands for REEs. Thus, the growth rate of supply will need to increase past the average 5.4% growth rate in total REE supply (Alonso et al., 2012). Despite the fact that historic growth rates have been as high as 34%, there are significant limitations to growth in the REE supply (Alonso et al., 2012). Thus, high levels of sustained growth in supply are likely not possible.
The U.S.G.S. estimates that total world REE reserves are 110,000,000 tonnes; however, a large percentage of these reserves are located in deep-sea manganese nodules. In addition, many of the REE reserves are either in small or low-concentration deposits. These factors make a large percentage of world REE reserves simply too expensive to mine with current methods. Thus, the number of readily mineable REE deposits is quite small. This is the main limiting factor in ramping up REE supply (Alonso et al., 2012).
Besides physical limitations, there are also many economic, environmental, and political limitations to increasing supply. Opening a mine requires high capital input (Innovation Metals Corp, 2012) due to the necessity of opening both new mining and refining facilities (Humphries, 2012). Environmental concerns always been an issue with mining, and REEs are no exception. The ores containing REEs often contain less savory components such as radioactive thorium and uranium. These components need to be safely isolated and stored. The mining process also produces tailings that cannot be released into the environment, lest they poison water supplies. Stringent environmental regulations therefore considerably complicate the opening of new mines because the environment dangers of the mines need to be appropriately dealt with. Finally, environmental law make opening new mines quite difficult due to high levels of regulation; these laws should certainly not be loosened, as this could result in huge environmental damage. However, obtaining the correct permits is a expensive and time-intensive process(For more information about mining laws, environmental regulation, etc. see other pertinent background pages). Thus, overall it is quite hard to increase supply at a rate high enough to meet increases in demand (Alonso et al.,2012; Moss et al.,2011).
Finally, there is a lack of security in the supply chain. In 2011, over 95% of global REE sypply originated from China. China is also has the largest demand for REEs, at 65% of total. The US is the next largest consumer, at 15% of total demand. In 2010, China announced a 40% reduction in exports of REEs. This created large instability in the REE market; there were no other major sources for REEs. China is expected to continue reduction of exports as it wants to reduce stress on its REE reserves (Hatch, 2012).
Inequality Between Supply and Demand
As has been explained previously, there is currently no inequality between total REE supply and total REE demand. Due to the many factors limiting growth in supply, there is no doubt that total REE supply will eventually lag behind total demand(Alonso et al., 2012; Department of Energy, 2011). The timeframe for total demand outgrowing supply will be discussed below on element-by-element basis.
So far, when looking at REE supply and demand only total values have been taking into consideration. However, for quite a few REEs, individual projected demand growth rates are much greater than the total demand growth rates (Alonso et al., 2012). Thus, in order for supply to equal demand, increased production for specific elements would be necessary.
However, this is not necessarily possible due to the limitations of co-mining. REEs are found together in parent ores. They are mined as a combined ore, and then later separated through chemical processing. Thus, it is impossible to increase production of a given REE without also increasing production of other REEs (Innovation Metals Corp., 2012). This is why the initial analysis outlined above only looked at the total supply and demand of REEs.
Co-mining means that the supply of each element is solely dependent on total amount of ore mined and the concentration of the desired element in that ore (Alonso et al., 2012). This is a major limiting factor when try to increase supply for a give REE. When companies mine combined ores, they try to sell as many products of those ores as possible. If a company increases total production of REEs so that they can meet the demand for a given REE, then they flood the market with the other product of the co-mining. This reduces the prices for the other products, which decreases the overall profitability of the mining. This may mean that it is not economically viable to increase total production so as to increase supply of a highly sought-after REE (Innovation Metals Corp., 2012; Alonso et al., 2012).
Due to the fact that all REEs are co-mined, individual analyses are necessary to determine exact imbalance for supply and demand. A sample analysis is given below for dysprosium. For demand and supply projections for neodymium, lanthanum, cerium, europium, terbium, and yttrium, see Department of Energy, 2011.
Case Study
Dysprosium is an essential element in the creation of permanent neodymium magnets. Dysprosium allows such permanent magnets to maintain their properties at high temperatures. Due to the high temperatures which exist inside electric motors and turbines, the main demands for dysprosium-doped magnets come from production of wind turbines and electric vehicles (Moss et al., 2011). Dysprosium is needed in order for these products to operate efficiently at high speeds.
As demands for green energy and green tech continue to rise, so does the demand for dysprosium (Department of Energy, 2011; Moss et al., 2011; Alonso et al., 2012) Projections show that the increases in use of green technology required to stabilize atmospheric carbon dioxide at 450 ppm would increase demand of dysprosium by 2600% over the next 25 years (assuming current demands for wind and electric motor applications are representative of future needs). However, current estimates show that production of dysprosium is predicted to increase by at most 6% per year. In order to meet the expected rise in demand, production would have to increase by more than twice as much, at a rate of 14% per year (Alonso et al. 2012). The figure below shows supply and demand projections for dysprosium until the year 2025.
Projections for Future Supply and Demand for Dysprosium, Based on Various Scenarios for Green Energy Demand
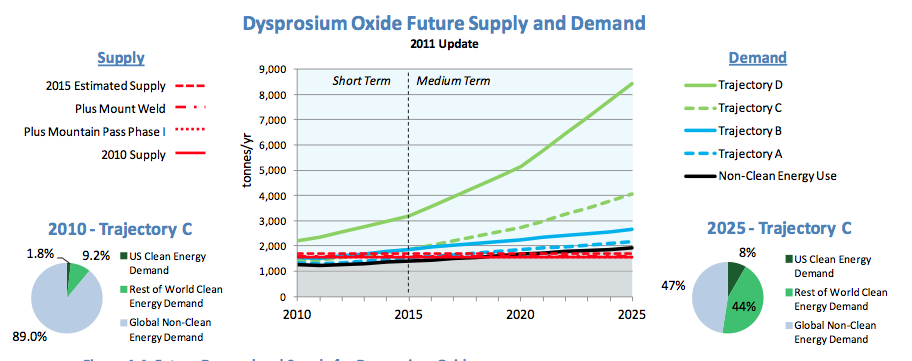
Source: Department of Energy, 2011
In the figure above, various demand scenarios are plotted against expected future supplies of dysprosium. It is crucial to note that for even the most optimistic of scenarios there is shortfall in future supply of dysprosium.
Past supply has generally been able to keep up with past demand, but current growth rates in production are simply too low to yield future equality, and the necessary ramp-up of production is difficult to achieve (Department of Energy, 2011). China's Ministry of Commerce (MOC) has recently reduced its export quotas for REEs. China produces 98% of the world's dysprosium, thus changes in China's export policy could severely reduce global dysprosium supply. As dysprosium is a heavy rare earth, it exists in much lower concentrations than other REEs (Alonso et al., 2012). It is therefore hard to ramp up production of dysprosium while still maintaining economic viability. Finally, although many new mines are coming online within the next few years (Lynas and Molycorp), their focus is exclusively on mining light REEs. Thus, the increase in supply due to their increasing production will have almost no effect on net dysprosium supply (Department of Energy, 2011).
Timeline
Using the projections discussed above, the following timeline was reached for inequalities in supply and demand for REEs.
2012: Current situation, demand equivalent to supply (Department of Energy, 2011; Hatch, 2012; Alonso et al., 2012).
2015: New Lynas and Molycorp refineries and mines fully online, supply in excess of increased demand for light rare earths. Heavy rare earths, are in slight supply deficits. Dysprosium is in a large deficit, supply is only 33% of demand (Department of Energy, 2011; Hatch, 2012; Alonso et al., 2012).
2025: Total demand has continued to grow to approximately 210,000 tonnes REO, total supply remains close at 220,000 tonnes REO. However, dysprosium and neodymium are experiencing major shortages. Dysprosium supply is only 15-18% of demand. Neodymium supply is only 40-60% of demand. High price fluctuation will exist for neodymium magnets, especially those with dysprosium. Green tech will become extremely expensive (assuming future REE demands are the same a current demands), due to the high price increases for dysprosium, neodymium and other REEs (Department of Energy, 2011; Hatch, 2012; Alonso et al., 2012)
2040: Dysprosium supply is less than 10 percent of demand. Other REEs may start to see demand increase greater than supply. The effect will be minor. Price uncertainty and high price increases for dysprosium will greatly reduce its use in tech. New green energy production using traditional generator techniques may not be possible due to extreme costs of component metals (Department of Energy, 2011; Alonso et al., 2012).
Cost of Inaction
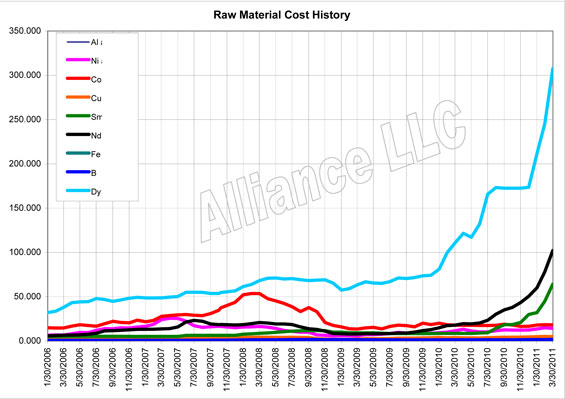
If nothing is done to either increase supply or reduce demand for REEs, the entire world will face high costs. Lack of REEs will cause large fluctuations in prices for many sectors of the global economy. In fact, the world is already paying for insufficient supply. For example, Dysprosium increased in price by almost 800% from 2006 to 2011 (Moss et al, 2011). This is an extremely large increase for a five-year period. In late 2011 and early 2012, the price dropped down significantly due to a decrease in demand (Onstad, 2012). The decrease in demand was mainly due to cost-saving substitutions of Nd-Dy magnets with more traditional non-REE magnets. Despite the uncertainty in prices, prices are generally expected to grow with time.
As the result, development and integration of green tech (especially green energy production) will be severely limited by cost factors. An average wind turbine can use up to 500 kg of neodymium and dysprosium per kilowatt generated (Department of Energy, 2011). The large amounts of rare earths used in green energy mean that significant price increases in REEs would result in large price increases in green tech. Due to use of REEs in many major manufacturing techniques, and their presence in many consumer electronics, it is certain that decrease in supply would affect prices across a wide range of sectors.
In summary, the problem of projected inequality of supply and demand in the REE market is a major concern. Although total REE demand and total supply are approximately equal (and are expected to remain so for some time), supply for individual elements such as neodymium and dysprosium will soon fall behind global demands. This will result in large price instabilities for many sectors of the economy, and will have negative effects on the integration and development of new technologies. The costs of this problem are simply too great to be ignored. Supply and demand inequality for rare earth elements needs to be addressed as soon as possible.
Alonso, E., Sherman, A. M., Wallington, T. J., Everson, M. P., Field, F. R., Roth, R., & Kirchain, R. E. (2012). Evaluating rare earth element availability: A case with revolutionary demand from clean technologies. Environmental science and technology, 46, 3406-3414. Retrieved from http://pubs.acs.org/doi/pdf/10.1021/es203518d
U.S. U.S. Geologic Survey. Minerals Information. Minerals Information. USGS Minerals. Web. 18 Nov. 2012. <http://minerals.usgs.gov/minerals/>.
U.S. Department of Energy, (2012). Critical materials strategy (DOE/PI-0009). Retrieved from website: http://energy.gov/sites/prod/files/DOE_CMS2011_FINAL_Full.pdf
Moss, R. L., Tzimas, E., Kara, H., Willis, P., & Kooroshy, J. (2011). Critical metals in strategic energy technologies. JRC scientific and technical reports, doi: JRC 65592. Retrieved from http://setis.ec.europa.eu/newsroom-items-folder/jrc-report-on-criticalmetals-in-strategic-energy-technologies/at_download/Document
Hatch, G. P. (2012, October). Dynamics in the global market for rare earths. Elements, 8, Retrieved from http://elements.geoscienceworld.org/content/8/5/341
Supply & demand issues. (2012). Retrieved from http://www.innovationmetals.com/supply-demand-issues/
Onstad, E. (2012, September 19). Analysis: Rare earth prices to erode on fresh supply, china . Reuters. Retrieved from http://www.reuters.com/article/2012/09/19/us-rareearths-outlook-idUSBRE88I0O020120919
Humphries, M. Congressional Research Service, (2012). Rare earth elements: The global supply chain (R41347). Retrieved from Congressional Research Service website: http://www.fas.org/sgp/crs/natsec/R41347.pdf

