The Neural
Control of Visually Guided Eye Movements
C. Cortical Mechanisms of Visually Guided Saccadic Eye Movements
 Figure
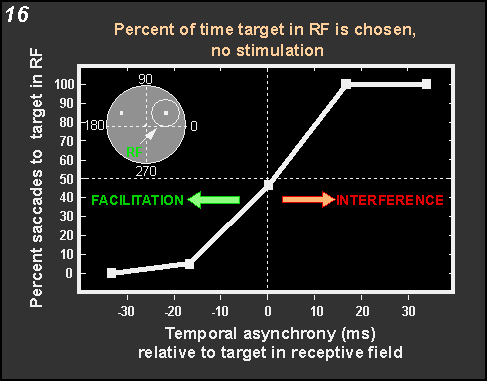
16 shows how the data were plotted. The percent of time the
monkey selected the target in the receptive field is plotted as a function
of the temporal asynchrony between the targets as shown on the abscissa.
If the stimulation were to increase the probability with which the target
in the receptive field of stimulated neurons is chosen, the curve should
shift to the left; this we call facilitation. If stimulation were to decrease
the probability of choosing the target in the receptive field, the curve
should shift to the right; this we call interference. Figure
16 shows how the data were plotted. The percent of time the
monkey selected the target in the receptive field is plotted as a function
of the temporal asynchrony between the targets as shown on the abscissa.
If the stimulation were to increase the probability with which the target
in the receptive field of stimulated neurons is chosen, the curve should
shift to the left; this we call facilitation. If stimulation were to decrease
the probability of choosing the target in the receptive field, the curve
should shift to the right; this we call interference.
|