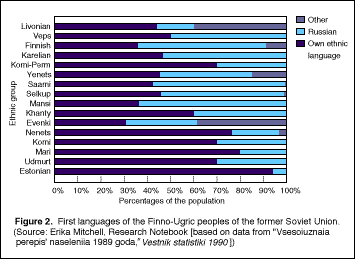
Use graphics to clarify relationships among complicated data sets. Converting Table 1 to a chart (Figure 2) helps draw out the results of a study of linguistic groups.
| Ethnicity | Own Ethnic Language | Russian | Other |
|---|---|---|---|
| Estonian | 95.46% | 4.38% | 0.16% |
| Udmurt | 69.64% | 30.04% | 0.31% |
| Mari | 80.81% | 18.80% | 0.38% |
| Komi | 70.39% | 29.45% | 0.14% |
| Nenets | 77.11% | 18.09% | 4.80% |
| Evenki | 30.42% | 28.47% | 41.11% |
| Khanty | 60.45% | 38.80% | 0.74% |
| Mansi | 37.05% | 61.99% | 0.96% |
| Selkup | 47.65% | 50.55% | 1.80% |
| Saami | 42.17% | 56.46% | 1.38% |
| Yenets | 45.45% | 38.28% | 16.27% |
| Komi-Perm | 70.06% | 29.69% | 0.25% |
| Karelian | 47.77% | 51.84% | 0.39% |
| Finnish | 34.55% | 54.55% | 10.90% |
| Veps | 50.84% | 48.52% | 0.64% |
| Livonian | 43.81% | 14.60% | 41.59% |
--Erika Mitchell, Research Notebook (based on data from "Vsesoiuznaia perepis' naseleniia 1989 goda," Vestnik statistiki 1990))