| Vol.
XXIX No.
1 September / October 2016 |
| contents |
| Printable Version |
Highlights from the 2016 Faculty and Staff
Quality of Life Survey
The Council on Family and Work monitors the state of family and work life at MIT and works to ensure MIT is a place where faculty and staff can have fulfilling and productive professional and personal lives. As part of its charge, the Council sponsors the MIT Faculty and Staff Quality of Life Survey. The Office of the Provost and the Chair of the Faculty serve as co-sponsors of the faculty portion of the survey.
In mid-January of this year, Provost Martin Schmidt and Executive Vice President Israel Ruiz invited MIT faculty and staff to participate in a quality of life survey. The survey was administered by the Office of Institutional Research. The purpose of the survey was to examine the work-life environment for faculty, other instructional staff, researchers, postdoctoral scholars, administrative staff, support staff, and service staff at MIT Main Campus and Lincoln Laboratory. Faculty received a similar survey in 2004, 2008, and 2012. The survey included other employee types beginning in 2012.
The survey covered a number of topics, including satisfaction, workload, work-related stressors, departmental climate, mentoring, integration of work and personal/family life, and the tenure and promotion process. It was based in part on a core survey developed by schools in the Association of American Universities (AAU).
The survey closed in late February with more than 7,000 responses. 57% of Main Campus staff and 45% of Lincoln Laboratory staff answered the survey. The response rate for faculty was 64%, slightly lower than the 66% rate in 2012.
As with all surveys run by Institutional Research, the survey data are treated as confidential, and the results are never presented in a way that individual respondents can be identified.
Below are some of the broad-level survey results, organized by topic area. The Council on Family and Work is preparing a more detailed analysis, which should be available later this fall.
Satisfaction
Faculty and staff appear to be quite satisfied in their roles at MIT. Ninety percent of survey respondents, overall, said they were somewhat or very satisfied being an MIT employee. See M.I.T. Numbers. Ninety-two percent of faculty reported being satisfied. Tenured faculty reported slightly higher satisfaction rates than tenure-track faculty. The rates ranged from 89% in Engineering to 97% in Sloan.
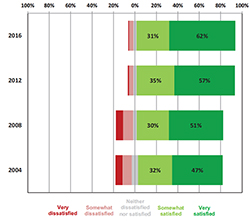
The last time this survey was administered (2012), the same percentage of faculty said they were somewhat or very satisfied in their overall role as faculty at MIT. However, the percentage of “Very satisfied” rose from 57% in 2012 to 62% in 2016. See Figure 2.
(click on image to enlarge)
When asked about their satisfaction with 22 specific items, faculty rated “Quality of graduate/professional students,” “Quality of undergraduate students,” and “Office space” as the top three items. The bottom three items were “Support for securing grants,” “Committee and administrative responsibilities,” and “Time available for scholarly work.” [The ranking of items is based on mean score.]
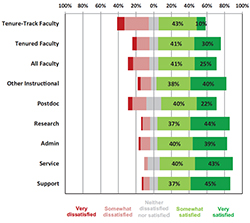
Faculty and staff were also asked, “Please indicate the degree to which you are satisfied with your ability to integrate the needs of your work with those of your personal/family life.” Seventy-seven percent of respondents said they were somewhat or very satisfied on this measure. Faculty and postdoctoral scholars, however, tended to have lower ratings compared to other staff types (66% and 63%, respectively). See Figure 3. A higher percentage of tenured faculty said they were satisfied with their ability to integrate work and family life compared to tenure-track faculty. In addition, female faculty and underrepresented minority faculty reported lower levels of satisfaction compared to their counterparts.
(click on image to enlarge)
Workload and Stress
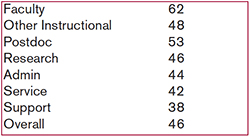
While faculty and staff indicated they were generally happy in their roles at MIT, they also reported working hard. On average, faculty and postdoctoral scholars reported working more hours per week than other employee types. See Figure 4.
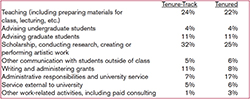
On the survey faculty were asked how they divided their time among various work-related activities. Tenured faculty reported spending more time on administrative responsibilities and less time on scholarship, compared to tenure-track faculty. See Figure 5.
(click on image to enlarge)
Nearly 60% of faculty said their workload was too heavy or much too heavy, while fewer than 1% said too light or much too light. For each of the other staff types, a majority answered “about right.” See Figure 6.

In tandem with the findings regarding workload, faculty were more likely than other groups to report being overwhelmed by all they had to do during the past year. Forty-seven percent of faculty said they felt overwhelmed “Often” or “Very Often”, compared to 33% for respondents overall. Tenure-track faculty reported being more often overwhelmed, compared to tenured faculty. See Figure 7.
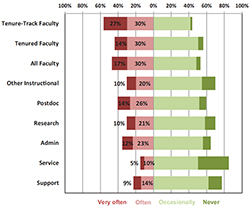
often have you felt overwhelmed by
all you had to do?
(click on image to enlarge)
The survey asked faculty to rate the extent to which 33 work-related and non-work-related items contributed to their stress over the past year. The top six sources of stress were: Lack of time to think and reflect; Securing funding for research; Scholarly productivity; Lack of time for friends and family; Managing a research group or grant (e.g., finances, personnel); and Teaching responsibilities.
| Back to top |
Climate
The survey had a number of questions about department/unit climate. Among them was one that asked faculty and staff to rate their level of agreement or disagreement with: I have a voice in the decision-making that affects the direction of my department, lab, or center. Fifty-two percent of the overall population said they somewhat or strongly agreed with this statement. Seventy-three percent of faculty agreed with the statement, up from 70% in 2012. See Figure 8 for a breakdown of faculty results by academic school.
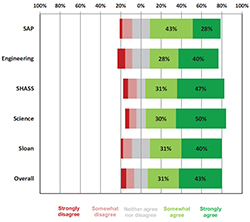
(click on image to enlarge)
Below are additional items asked of faculty in this section of the survey. The figure next to each statement is the percent of faculty who answered “Somewhat agree” or “Strongly agree.”
83% - My primary department is a good fit for me.
71% - I have the resources (equipment, training, budget, etc.) I need to do my job well.
77% - My department’s procedures are fair and equitable to all.
88% - My chair/director/dean creates a collegial and supportive environment.
74% - MIT values my research/scholarship.
66% - MIT values my teaching.
84% - In my workplace everyone is treated with respect.
58% - I feel supported when trying to take actions/make change.
Mentoring
The survey asked several questions on mentoring, including one about whether or not faculty and staff felt as though they had received adequate mentoring while they were at MIT. More than half of service staff chose “Not applicable” for this question – compared to just 12% of faculty. Faculty were more likely than other groups to say they had received adequate mentoring. The rate for tenure-track faculty was higher than tenured faculty (70% “Yes” compared to 61%). See Figure 9.
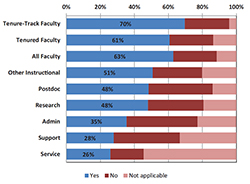
as though you have received
adequate mentoring?
(click on image to enlarge)
Tenure and Promotion
On the survey faculty were asked if the criteria for tenure are clearly communicated, the extent to which various items are valued in the tenure process, and how appropriately those items are valued.
Tenured faculty were more likely than tenure-track faculty to agree that the criteria for tenure were clearly communicated. Faculty reported that research/scholarly work and professional reputation were most valued in the tenure process. See Figure 10. When asked how appropriately the same items were valued in the tenure process, more than a third of faculty said “Advising and mentoring” and “Teaching contributions” were at least somewhat undervalued.
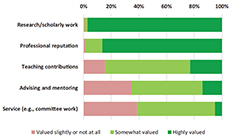
in the tenure process?
(click on image to enlarge)
Open-Ended Comments
On the survey, faculty were asked several open-ended questions, including “What do you wish you could spend more time on?” and “What do you wish you could spend less time on?” About half of faculty answered these questions. Each comment was read and assigned to one or more response categories.
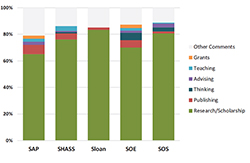
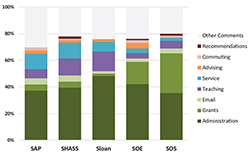
Nearly three-quarters of faculty said they wanted to spend more time on research. More than half of faculty said they wanted to spend less time on administrative-related duties (e.g., administration, grants, and email). See two charts below.
| Back to top | |
| Send your comments |
| home this issue archives editorial board contact us faculty website |