:: Function ::
:: Calculations :: Data Collection :: Outputs ::
How are analyses presented?
After data is input, CITYgreen 5.0 runs its models and produces a final one-page report [sample]. On this report, users find information on the structure of their site, the ecological services provided by the trees, as well as the breakdown of economic benefits.
CITYgreen is also able to model alternative scenarios to the output. This is an interesting feature that allows different landcover impacts to be modeled and compared to the original and to one another.
As CITYgreen is GIS based, creating maps for presentation is a straightforward process (see Fig 1.)
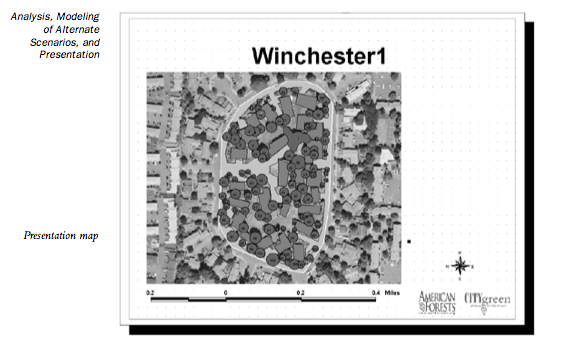
Fig
1. CITYgreenmap presentation
Source: CITYgreen Manual (contact American
Forests for copy)
UFORE is somewhat more limited in the ways in can present results. The SAS based version is able to present analyses in four ways: charts (1,2,3) tables, maps (very limited, but should improve when recoded), and data files. [More examples of charts and tables] Raw data files of the results can be exported to other applications for more detailed analysis, or to present the data ways that UFORE is not able.