| Vol.
XXIII No.
3 January / February 2011 |
| contents |
| Printable Version |
Faculty and Student Diversity at MIT: Facts and Figures
This article summarizes the present facts and figures associated with diversity at MIT.
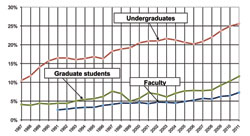
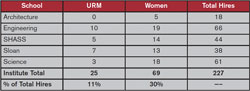
Figure 1 shows percentages of underrepresented minority (URM) undergraduate and graduate students, as well as faculty, going back to 1987 and 1991, respectively. As the graph indicates, the percentage of URM undergraduate (UG) students among the domestic (i.e., US citizens and permanent residents) UG student body today is approximately 26%. Similarly, the percentage of URM graduate (G) students among the domestic G student body today is approximately 12%. The percentage of URM faculty at MIT at this time is 7.3%. In the last five years, MIT’s departments and Schools have been hiring URM faculty at a rate of 11% of the total hires (see the Table). All these percentages have been steadily increasing.
(click on image to enlarge)
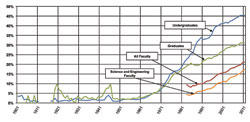
Figure 2 shows percentages of UG and G women students going back to 1901, and MIT women faculty as well as Science and Engineering MIT women faculty going back to the early 1980s. As the graph indicates, the percentage of women UG students today is a little over 45%, and the percentage of women G students is close to 32%. The percentage of women faculty at MIT is 21%, and the percentage of women faculty in MIT’s Schools of Science and Engineering is 17%, both increasing.
(click on image to enlarge)
As theTable indicates, in the last five years MIT’s departments and Schools have been hiring women faculty at a rate of 30% of the total hires.
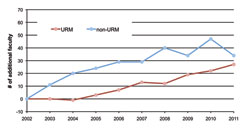
Figure 3 shows the net change in the URM and non-URM faculty population at MIT in the last 10 years. In October 2001, MIT had 47 and 909 URM and non-URM faculty, respectively. In October 2010, MIT had 74 and 943 URM and non-URM faculty, respectively; i.e., 27 out of the net growth of 61 faculty members are URM faculty, representing 44% of the net faculty growth in the last ten years.
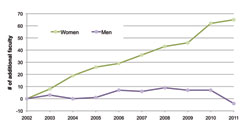
Figure 4 shows the net change in the women and men faculty population at MIT in the last 10 years. In October 2001, MIT had 152 and 804 women and men faculty, respectively. In October 2010, MIT had 217 and 800 women and men faculty, respectively; i.e., 65 out of the net growth of 61 faculty members are women.
These facts and figures point towards an MIT whose community of undergraduate and graduate students, as well as faculty, is becoming increasingly diverse.
| Back to top | |
| Send your comments |
| home this issue archives editorial board contact us faculty website |