![]()
So Lab - BEAM Bioinstrumentation Engineering Analysis and Microscopy
|
Research in the So Lab Spectrally Resolved Fluorescence Correlation Spectroscopy (FCS) |
|||
|
|
Investigators: Michael Previte, Serge Pelet, Ki Hean Kim, Christoph Buehler With
the development of dual-color FCS [1] and,
more recently, tri-color FCS [2], it is now
possible to analyze the dynamics of multi-component processes such as
nucleic acid single strand annealing, antibody-antigen interactions, or
ligand-receptor binding. In these studies, the cross correlation signal
relies on good spectral segregation of the individual dyes. Presently,
no two-color FCS system completely eliminates spectral bleed through or
crosstalk in individual detection channels. Thus there exists a lower
limit for detectable associated two-color product, which limits the visualization
of important bimolecular processes. |
||
|
|
Magde,
Elson, and Webb developed Fluorescence Correlation Spectroscopy (FCS)
in 1972 at Cornell University [3]. Previous
to FCS development, chemical kinetic constants and diffusion coefficients
were measured by introducing perturbations to a chemical equilibrium and
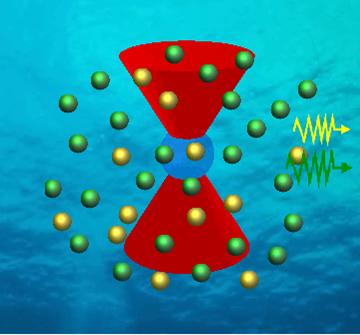
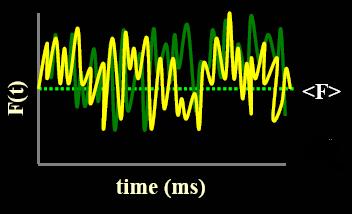
observing the system’s response. With FCS, fluctuations in a system
can be measured in without perturbing its equilibrium. |
||
|
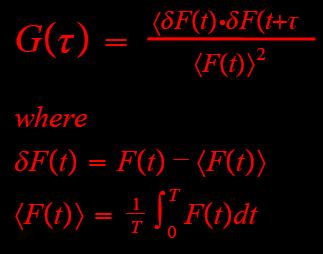
Figure 1c: Autocorrelation, G(tau), equation. |
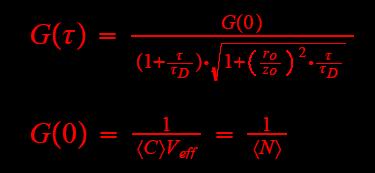
Figure 1d: These fluctuations are directly proportional to diffusion (tauD) and to the number of molucules (N). |
||
|
Combining the advantages of improved excitation sources, optics, and photodetectors with readily available high quantum yield dyes with good spectral separation, multi-color FCS has emerged as a technique that already plays an integral role in biotechnology [4-6]. Figure 2 shows two-channel and three-channel setups for FCS enabling the feasibility of two and three-color FCS. The advantage to this configuration is that multi-labeled species can now be detected independently, i.e. bound species give rise to an independent cross correlation signal. |
|||
|
|
|||
|
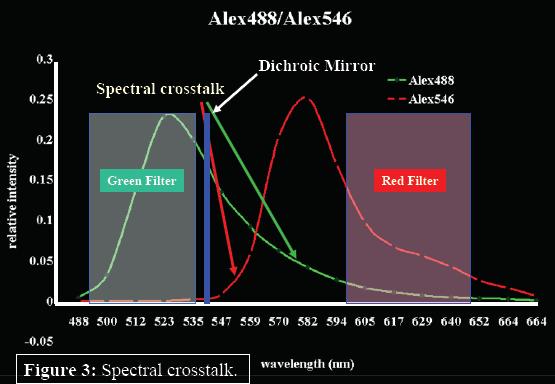
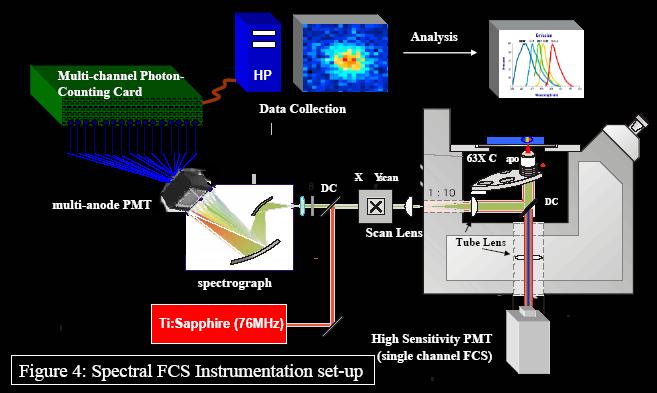
Although this independent signal for multi-labeled species improves their detection, a lower detection limit for multi-labeled species exists because of the of crosstalk between detection channels. If dyes have spectra that are not well resolved (as seen with Alexa 488 and 546, Molecular Probes, Eugene, OR), dichroics and filter choices become limited, photon counts are lost, and FCS signal and results are compromised (Figure 3). In an attempt to provide a solution to this problem, we have combined a 16-channel multi-anode PMT with a 16-channel single photon counting card and a spectrograph to spread the fluorescent emission spectrum into the 16-channel array detector (Figure 4).
Since we are single photon counting, we can perform FCS or SRCS. The advantages to this configuration are (1) all of the emitted photons are collected along with (2) the spectral information. We capitalize on these advantages by using a different global fitting algorithm for data analysis (shown below). For a 4 nM yellow-green (505/515) 20 nm bead solution (Molecular Probes), we took data at 10-microsecond time intervals for approximately 30 seconds. Figure 5 shows the autocorrelation signal for some individual channels and the summation of the individual channels.
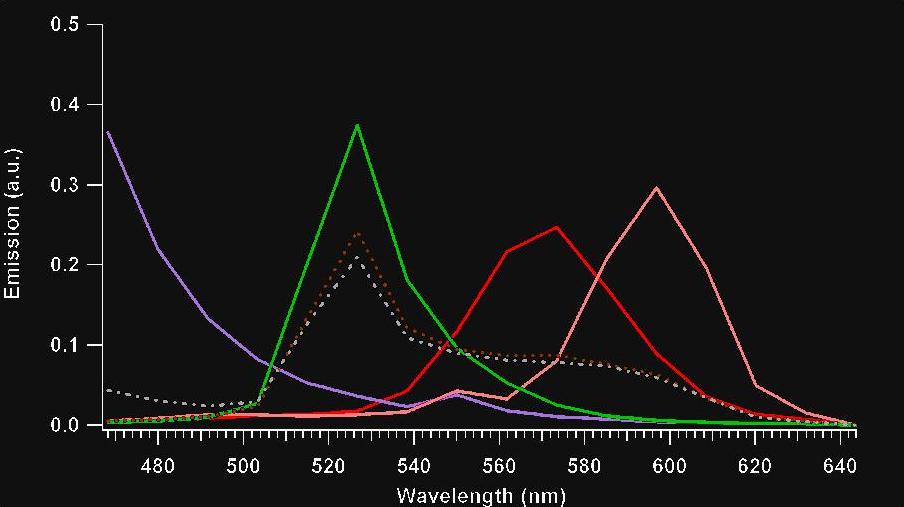
Using mixed bead solutions, we attempt to recover their individual ratios using a global fitting algorithm. Spectra for single and multi-color bead samples are shown below (Figure 6) We attempt to recover the respective bead ratios for each solution using a global fitting algorithm shown below. This approach is compared with the traditional FCS fitting cross correlation data fitting algorithm.
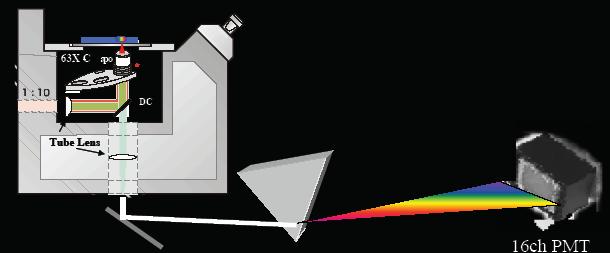
Figure 6: Emission spectra of single sphere samples and multi-spheres: (a = purple) Plum purple 60 nm beads, (b = green) Yellow-green 40 nm beads, (c = red) Nile Red 40 nm beads, (d = pink) Red 40 nm beads, (e = dashed brown) Sum spectra for Yellow-Green:Red: Nile Red (1:1:1), and (f = dashed grey) Sum spectra for Yellow-Green:Red:Nile Red:Plum Purple (1:1:1:1). In conclusion, our FCS measurements suggest that the combination of our unique detection system and our global fitting analysis routine improve upon standard FCS techniques. Although we have been capable of improving these FCS measurements, our detection sensitivity remains an inherent difficulty with our technique. Our attempt to solve this problem evolves around the redesign of the spectral detection scheme. We plan to replace the de-scanning optics and spectrograph with a silver mirror and AR coated Brewster cut prism to improve our signal to noise ratios (Figure 7).
|
|||
|
1.
Schwille P. et al. (1997), Biophys. J. 66:211. |
|||
[ So Lab - Mission Statement - Research - People - Documents - Facilities - Links - Resources - Sign-up Sheets ]
Comments about this webpage? Email us!