| home this issue archives editorial board contact us faculty website |
| Vol.
XVII No.
1 September/October 2004 |
| contents |
| Printable Version |
The Management of the MIT Endowment
We have prepared this article in response to a request for comments on the management of the MIT Endowment. With the increased importance of the Endowment in the financing of activities at the Institute, this is a wonderful opportunity to more completely describe the management of these assets to the Faculty, a core constituency of the Institute. A better understanding of how these assets are managed and how distributions from the Endowment are determined is essential to the setting of realistic expectations of the potential distributions from these funds in the future, and to further an understanding of the underlying obligations of the Institute to these funds, which are the result of gifts from many generations of alumni and friends of MIT.
In setting out these comments, we have drawn from recent presentations to the Academic Council and various departments. We are available for more direct discussions with other departments and laboratories to further elaborate on the comments presented here, and look forward to the observations of the faculty on the management of these assets and the distribution policies described.
Organization and Conceptual Overview
The investment policies governing the endowment are established by a standing committee of the MIT Corporation, the Investment Committee, in accordance with Section 16 of the Bylaws of the Corporation of the Massachusetts Institute of Technology. The Investment Committee is comprised of nine members of the Corporation, two of whom, the Chairman of the Corporation and the Treasurer of the Corporation, serve as ex officio members. This Committee meets three or four times annually to review investment policies and monitor investment activities and results for the Endowment and other assets of the Corporation. The implementation of the policies approved by this Committee is carried out by the Office of the Treasurer through external investment management organizations. The Corporation recently approved the formation of the MIT Investment Management Company, effective July 1, 2004. The major impact of this change will be to add additional members to the Board overseeing the management of the Institute's assets.
Endowment assets are those assets resulting primarily from gifts to the Institute where the donors have imposed the condition that only the income provided by the investment of the gifts might be expended for the educational and research purposes of the Institute. These assets are known as True Endowment assets. In addition, the Executive Committee of the MIT Corporation may designate otherwise expendable funds to be managed as Endowment funds. These latter funds are known as Quasi-Endowment (or Funds Functioning as Endowment ). Either of these two classes of endowment assets may be restricted as to purpose of use, such as strictly for scholarships or fellowships, for professorships, or for research; or they may be unrestricted as to purpose of use, in which case they are known as Unrestricted Endowment and are available for any general purpose of the Institute. Since the major focus of this discussion is on the management of these assets, rather than the use of these funds, we will not focus further on these distinctions, other than to note that it is necessary for the Institute to carefully balance its budgetary needs with the nature of the resources available to it from the endowed assets.
| Back to top |
Another aspect of this discussion is to note that the primary investment pool for the Endowment is known at MIT as Pool A. Although Pool A is neither the complete Endowment nor is it comprised only of Endowment assets, it is for this discussion a good proxy to discuss the management of the Endowment and the annual distributions that support operations. A department's funds that are invested in Pool A will receive annual distributions based on the number of units held in the Pool. The units are valued monthly and new gifts or other additions to the Pool are credited with new Pool A units based on the current month's unit market value. In many respects this is similar to the creation of shares in an open-end mutual fund, about which many may have direct personal experience.
The Pool A assets are managed to maximize total investment return relative to appropriate risk, which in this case refers to the volatility of returns. The challenge is in developing investment and distribution policies which over time support the operations of the Institute and protect the underlying purchasing power of the endowed assets. Investment income earned (in the form of interest, dividends, and rents) and a portion of investment gains are distributed in a manner that, over the long term, allows for the retention and reinvestment of an amount at least equal to the inflation rate, thereby satisfying the legal obligation to endowed funds.
Financial Strength of the Institute
Before more completely describing the management of these assets, we emphasize that the Institute is a financially stronger institution today than it was 20, or even 10, years ago. A few numbers describing the general investments of the Institute, the bulk of which is the Endowment, will illustrate this point. In presenting this information, and other data to follow, we note that the financial records for Fiscal 2004 will not be finalized until October 2004. In addition, some information on peer and benchmark measures are not yet available for Fiscal 2004. We are therefore presenting both 2003 and 2004 information where available, not to suggest that the short term performance should be the basis of presentation, but rather to provide both comparable information and the most current information possible.
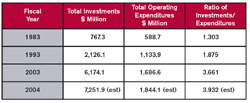
A tripling of the ratio of total investments to operating expenditures over the past 20 years is only one of many measures that demonstrate a financially stronger institution than in prior years. This has occurred as a result of two enormously successful capital campaigns, the Campaign for the Future, which raised $710 million in 1987 to 1992, and the Campaign for MIT, now closing in on $2 billion in gifts and pledges over the period 1999 to 2005. The generally favorable investment climate for much of the last 20 years is another important factor, as well as an appropriate balance between current and future needs through the application of a moderate distribution rate and the reinvestment of a portion of the investment return for future generations – the intergenerational equity issue. This is not to suggest that this institution does not face continuing challenges on both an absolute and relative basis. It is only to emphasize that we face this future much stronger than we did a few years ago.
Endowment Investments, Past and Present
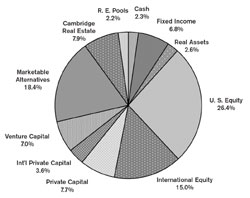
Figure 1 presents the investments of Pool A as of June 30, 2004. Pool A assets were $6,141.8 million, an increase of $748.1 million from the $5,393.7 million of June 30, 2003. This change in market value, 13.9%, is not the investment return for the year. It is the change in asset value which is comprised of income, market value appreciation (or depreciation), new gifts added to the investment pool, less amounts distributed for spending. Investment return is that measure of change in value due solely to investment results and does not take account of new gifts or of the amount distributed for spending. For the fiscal year just closed, the investment return was 18.1%. Since the amount distributed for spending always includes a portion of gains, the change in asset value will always lag the investment return, unless gifts received are unusually large. In reviewing Figure 1 and other comments on the asset classes comprising Pool A, reference may be made to the Glossary for a better understanding of the asset classes in which MIT invests.
The overall policy allocation of Pool A has changed over the past 10 years, a period of time during which economic outlook went from euphoria to malaise. The Pool A strategic asset allocation is reviewed annually by the Investment Committee and changed only modestly as a result of periodic studies which incorporate a broad range of inputs on expected returns, volatilities and correlations among the asset classes considered for investment. These portfolio optimization studies, including Monte Carlo simulations of longer term expected values for the endowment, are inherently sensitive to the quality of the inputs and tend to reflect recent performance results and outlook. The range of inputs from consultants, investment managers, and other institutional investors helps to provide a general guideline to an "optimized" portfolio, optimized in the sense of expected return and volatility (risk). The optimized portfolio further incorporates boundary conditions and other practical constraints that reflect a sense of the execution skills of staff and the viewpoints of the staff and the Investment Committee as to where the best risk-adjusted investment return will be realized. The objective of this effort is the construction of a portfolio with assets showing low correlation with each other, to minimize overall portfolio volatility while maximizing expected portfolio return over time. The most uncertain aspect of this approach is the short-term volatility.
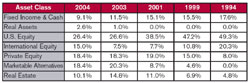
Table II shows the changes in the asset allocation over the past one, three, five and 10 years back to Fiscal 1994. Some important changes in outlook are reflected in these allocations.
While there are few unidirectional changes during the past 10 years, there now is a substantially decreased exposure to the domestic equity markets and fixed income markets, and a significantly increasing exposure to marketable alternatives, private equity (both venture capital and private capital), and real estate (see Glossary) during this period. As described above, these changes reflected policy guidelines and outlooks as reviewed periodically with the Investment Committee of the Corporation.
In practice, we are guided by a policy portfolio with allocation weights centered on a single value for each asset class, but we allow for variation within an acceptable band around that value. The Pool A policy portfolio and the acceptable bands for fiscal 2004 are shown in Table III.
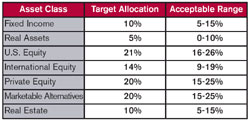
The very slight differences between actual allocations and the policy range for U.S. Equity primarily reflects implementation issues with regard to allocating funds to external managers and to some degree the result of market action. Significant out-of-range allocations are rebalanced periodically.
| Back to top |
Performance
How does the MIT asset allocation compare with that of other colleges and universities? This information is collected periodically by Cambridge Associates, a consulting organization with whom MIT has worked for more than 25 years. Figure 2 compares the MIT Pool A Allocation to that of the Cambridge Associates Mean Allocation at the end of Fiscal 2003. Peer information for Fiscal 2004 is not yet available.
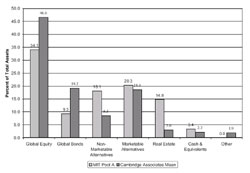
In general, our underweight in Global Equity (Domestic and International Equities) and Global Bonds (Fixed Income) is offset by an increased allocation to Non-Marketable Alternatives (Private Equity) and Real Estate. Such differences are less pronounced in comparison to the largest endowments in the survey group, as they have a greater fraction of their assets in alternative investments and a commensurate reduction in the marketable securities areas.
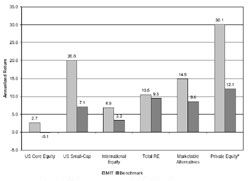
Figure 3 presents a comparison of the investment results for each Pool A asset class to its respective benchmark for the five years ended December 31, 2003, the last date at which all benchmark information was available for the broad range of alternative assets.
All the benchmarks against which the Pool A performance is measured are widely accepted standard benchmarks, with the exception of that for International Equities, which was custom designed by MIT with the assistance of Professor Stewart Myers of the Sloan School for the purpose of deemphasizing larger capitalization markets in the international sector and affecting external manager behavior. Since adoption in 1998, the MIT Custom International Benchmark has exceeded the index more commonly used in the investment management field, and our managers have outperformed the Custom Benchmark. It is to be especially noted that for each of the asset classes the Pool A managers have outperformed the respective benchmarks for the five-year period, a few by quite significant margins.
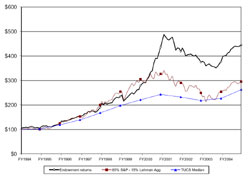
Another way to review the longer term history of the investment results is to compare the aggregate results to a proxy for the portfolio. In this case we have selected a composite of 85% in the domestic equity market, measured by the S&P 500 Index, and 15% in the domestic bond market, measured by the Lehman Aggregate Bond Index, as well as the median return of all funds in the Trust Universe Composite Service ("TUCS"), the broadest comparison of institutional asset pools, over the period 1994 through 2004. We chose the 85/15 proxy as Pool A has been comprised of 85% equity or equity-like assets. Figure 4 illustrates these comparisons.
Recent comments about endowment performance over this period recognize that the Institute participated significantly in the strong markets of the late 1990's through the early part of Fiscal 2001, substantially outperforming a broad universe of comparable funds and in particular a portfolio proxy without any alternative assets participation. However, the fall in relative and absolute performance for the past three years, as illustrated in Figure 4, has raised concerns about the investment policy and also the distribution policy which has been followed. We also have had inquiries about distribution models that may be used by other major private universities.
While there have been adjustments over the past few years in the allocation of assets, the general tenor of our policy has been constant over the past three years. The recovery noted in this past year emphasizes the underlying rationale of the Pool A policy portfolio.
Let us examine the history of the distributions from Pool A with these thoughts in mind.
Distribution Policy
Over the 28-year period from 1970 through 1998, the annual distribution from the endowment grew 6% annually, with no decrease from year to year. The policy guidelines over this period varied as the respective Investment and Executive Committees looked to formulations as guidance in balancing the need for current resources against sustaining the longer term purchasing power of the Endowment. In addition, from 1973 to 1998 there was only one annual increase greater than 10% (10.4% in 1989) in the distribution rate. During this period specific formulas were used as guides, rather than being followed explicitly. The most recent formulation sets the distribution rate in the range of 4.75% to 5.5% of the lagging 36-month average unit market value.
This formulation and the sharply increased unit market values due to the strong investment performance in the late 1990's resulted in the distribution increasing at an average annual compounded growth rate of more than 19% from 1998 to 2003, as illustrated in Figure 5.
This rate of growth in the distribution rate coincided with the very robust markets and a call for increased resources to fund initiatives outlined by President Vest's 1998 report, entitled The Path to the Future, and described in more detail by Provost Brown in his article titled "Financing MIT" in the December/January 2004 issue of the MIT Faculty Newsletter (Vol. XVI No. 3). As the baseline distribution indicated by the formula (the long-term distribution rate applied to the three-year average market value) did not meet demands for resources outlined in that report, the balance was supported by an additional allocation by the Executive Committee of $500 million of Endowment de-capitalization (technically a draw on unrestricted quasi-endowment ) . That program , authorized for the period 2000-2010, is being implemented on that original schedule.
Comparison to Other Distribution Policies
There are many other distribution models in use at peer endowments which serve either as firm formulae or as indicative guidelines. These include a cap on the annual rate of change in the distribution rate, a model followed by at least one major endowment during the "bubble" period. Another model defines the distribution as a weighted average of prior year's spending and a percentage of this year's market value, a so-called 70/30 formula. The formula generally uses the "spot" market value, as the prior year's spending itself incorporates prior year market values (through a recursive application of the formula). This approach is effectively a modified exponential weighting of market values, adjusted for inflation.
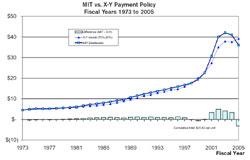
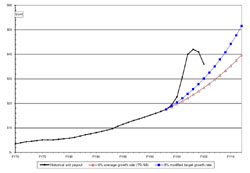
Figure 6 presents a comparison of what the MIT distribution would have been with the 70/30 formula applied to the Institute's actual investment results from Fiscal 1973 through Fiscal 2005. The spot unit value used here is of the December preceding the fiscal year for which a budget is being prepared, as the Institute's budget is finalized in the winter months preceding a fiscal year. While the resulting distribution rate would have been smoother from 1998 through 2005 than we experienced under our current formula, the distribution would have been cumulatively almost $26 per unit less than what was historically distributed, half of which was post-1998. To the extent operations and the new initiatives were to follow their original time plan, the draw on quasi-endowment assets would have had to increase by that amount. With a nominal seven million units in the Endowment over the 1998-2005 period, the difference of $13 per unit distribution would have resulted in an additional $85 million of draw on unrestricted quasi-endowment funds.
Even with the subsequent decrease in the distribution rate over the past two years, the distribution rate from 1998 through 2005 will have grown at an annually compounded rate of over 10%. While the purposes for which the increased rate of change in the distribution was effected were appropriate and directed to important initiatives, there is the question of what can we reasonably expect for the future rate of growth in the distribution?
This longer-term outlook is suggested by Figure 5, above. The average annual growth rate in the distribution rate was 6.15% for the 1970 through 1998 period. This period included years of economic strength, of economic weakness, of high inflation, and of low inflation - essentially a full spectrum of economic results. Based on this history, it seems difficult to expect that distribution rates should grow on balance much more than 6% annually. On a rough, intuitive level, the 6% growth in distribution is the net of investment return of the Endowment, less the annual distribution . In those terms, the average investment return of the Endowment was 11% over that period. This is only a rule-of-thumb, as the process of calculating the distribution incorporates a 36-month average of market values, and the distribution rate as a percent of market value varied over that period. But as such, it gives a ballpark figure for us to consider the impact of the current market environment and a 5-6% effective distribution rate (incorporating the impact of the use of quasi-endowed funds raises the effective distribution rate). To continue the comparison, Figure 5 shows two projections, one at 6% and one at 8%. It is to be noted that had the 1998 distribution rate been increased at a 6% rate from 1998 forward, the fiscal 2005 distribution would have been $26.40 per unit, and the projection at 8% would have yielded a $30.10 per unit distribution, in comparison to the $36.00 per unit currently being distributed.
The challenge for the future is to achieve an appropriate coupling of the distribution rate to a longer term view of what can be expected from investment results, and by doing so, balance the funding of our current needs with our obligation to ensure the financial, and ultimately the operational, flexibility of the Institute.
We welcome the opportunity to discuss these issues further with interested members of the community and thank the editors for providing an opportunity for a broader discussion of the investment program and its implications for support from the Endowment.
| Back to top | |
| Send your comments |
| home this issue archives editorial board contact us faculty website |