| Vol.
XXX No.
5 May / June 2018 |
| contents |
| Printable Version |
Engineering Enrollment Data at MIT
According to a report of the Computer Research Association (CRA), undergraduate (and graduate) enrollment in Computer Science (CS), over the years 2006-2015 has increased dramatically.1
The average number of undergraduate CS majors is larger today than at any previous time, and greatly exceeds the peak enrollment of the dot-com boom period. For example, the average number of CS majors at doctoral-granting academic units2 has more than tripled since 2006 and more than doubled since 2011.3
The report goes on to describe how this expansion – in nonmajor enrollment as well as major – has affected diversity; challenged faculty workload, strained instructional resources, increased demands for space. A section reports on how academic units are responding to these challenges.4
The National Academies established a committee to study the Growth of Computer Science Undergraduate Enrollments.5 They met eight times in 2016 and produced a report, Assessing and Responding to the Growth of Computer Science Undergraduate Enrollments (2017). Since 2009, the number of undergraduate degrees in CS has increased by 74 percent (at non-profit institutions). Like the CRA report, this document considered strategies schools might pursue (and are pursuing) to accommodate this increase in enrollment, strategies . . .
– such as adding faculty and resources, imposing targeted controls on enrollment, or using innovative technologies to deliver instruction to large numbers of students, among many other options.6
This brief paper looks at MIT enrollment data within this context. Of interest is in how this surge in computer science enrollment has affected enrollments in other fields of engineering (and science).

(click on image to enlarge)
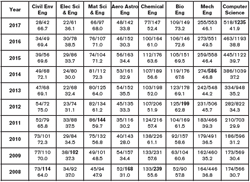
The portion of the bar “Computer Science” is an aggregation of data for the majors Computer Science and Engineering, VI-3 (Fall 2017 count 757); Computer Science and Molecular Biology, VI-7 (73); Computer Science, Economics and Data Science, VI-14 (22); Electrical Engineering and Computer Science, VI-2 (380), and Aerospace Engineering with Information Technology, XVI-2 (0).
(click on image to enlarge)
In the table the first number in each cell is the number of women enrolled in the major. The second is the total number of students, enrolled. The decimal number below is the percentage of the total who are women. The total number in bold is the maximum over the year cited. Source: https://web.mit.edu/registrar/stats/yrpts/
Computer Science, Economics and Data Science, VI-14 (22) is the most recent new joint major, first open to students in the fall of 2017.7
Computer Science and Molecular Biology, VI-7 was launched in fall 2011.
The degree program Aerospace Engineering with Information Technology XVI-2 was begun fall of 2000. It attracted some 20 students throughout the years until the program was phased out in 2014.
The portion of the bar Mechanical Engineering is an aggregate of data for the department’s two majors, “Course 2” and “Course 2A” and the major Mechanical and Ocean Engineering 2-OE. Prior to 2006, the latter was an independent department.

(click on image to enlarge)
The two bar graphs show enrollment in Course 2 and Course 2A over the past 20 years.8 Data for fall 2007 shows Mechanical Engineering Course 2 enrolling a total of 302 students, 104 (34%) women. Fall 2017 shows a decrease in the total to 249 students, 106 (43%) women. The popularity of the program Mechanical Engineering Course 2A increased over the same period. Total number of students went from 83, 35 (42%) women, to 295, of whom 142 (48%) were women. Course 2A, compared to the traditional Course 2, offers the student more elective freedom allowing a choice of technical electives outside the department.
The total enrollments for three of the engineering majors – Aeronautics and Astronautics, Chemical Engineering, and Civil and Environmental Engineering – includes the number of undergraduates who have chosen an option within each major that offers the student more freedom in choosing courses beyond the core requirements of each major. Aeronautics and Astronautics XVI-ENG and Chemical Engineering X-ENG were launched in fall 2011. Civil and Environmental Eng I-ENG did not become available to students until fall 2014.
MIT Student Enrollment, School of Science

(click on image to enlarge)
A look at enrollments in the School of Science over the same period reveals a different picture. Whereas enrollment in the School of Engineering has increased (almost) uniformly over the years, here the picture is one of decrease. Particularly noteworthy is the drop in numbers of students choosing to major in Chemistry, in Biology, and in Brain and Cognitive Sciences.

(click on image to enlarge)
The “new” major, Math & Computer Science, shows again the draw of computer science in attracting students.
Footnotes
1https://cra.org/data/generation-cs/phenomenal-growth-cs-majors-since-2006/
2 The term “academic unit” or “unit” denotes the administrative division responsible for the CS bachelor’s program. Often, but not always, this is an academic department.
3 The CRA credits its own Taulbee Survey: https://cra.org/resources/taulbee-survey/
4 A CRA spin-off committee, the “Booming Enrollment Committee” addressed four questions: How are departments responding to the “boom”? Is the “boom” affecting all levels of the curriculum? Why are students so eager for our classes? How will the current “boom” impact diversity in an already demographically, homogeneous field? http://mags.acm.org/inroads/june_2016?folio=12&pg=14 - pg14
5https://www8.nationalacademies.org/cp/projectview.aspx?key=49765.
6http://www8.nationalacademies.org/onpinews/newsitem.aspx?RecordID=24926
7https://news.mit.edu/2017/mit-creates-new-major-computer-science-economics-data-science-0904
8http://kiwi.mit.edu/mit-gender-diversity
| Back to top | |
| Send your comments |
| home this issue archives editorial board contact us faculty website |