
| ||||||||||||||||||||||||||||||||||||||||||||||||
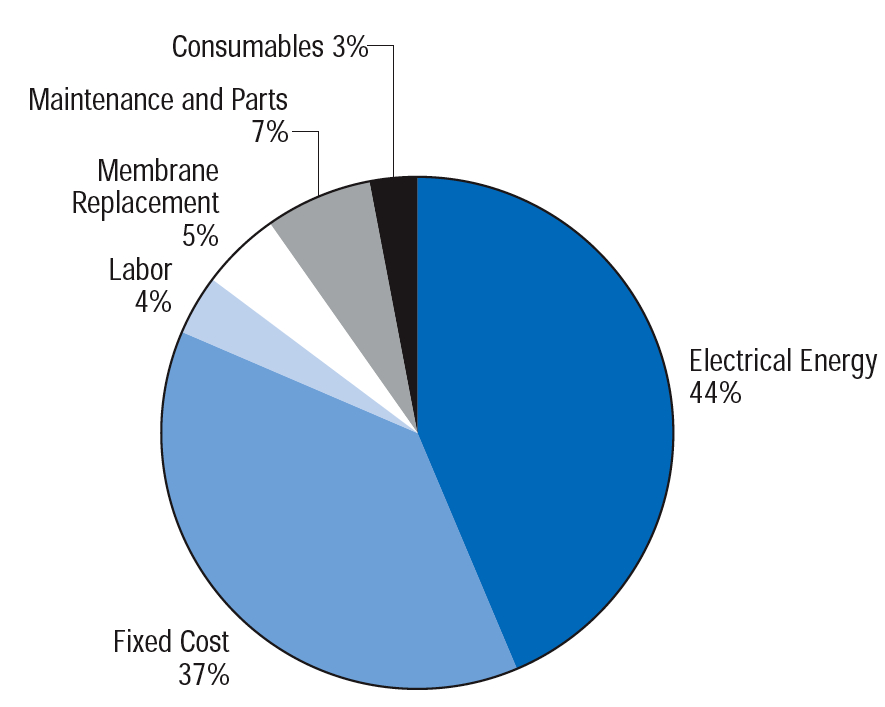
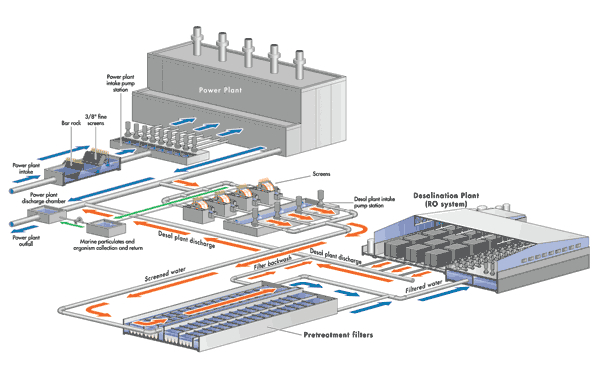
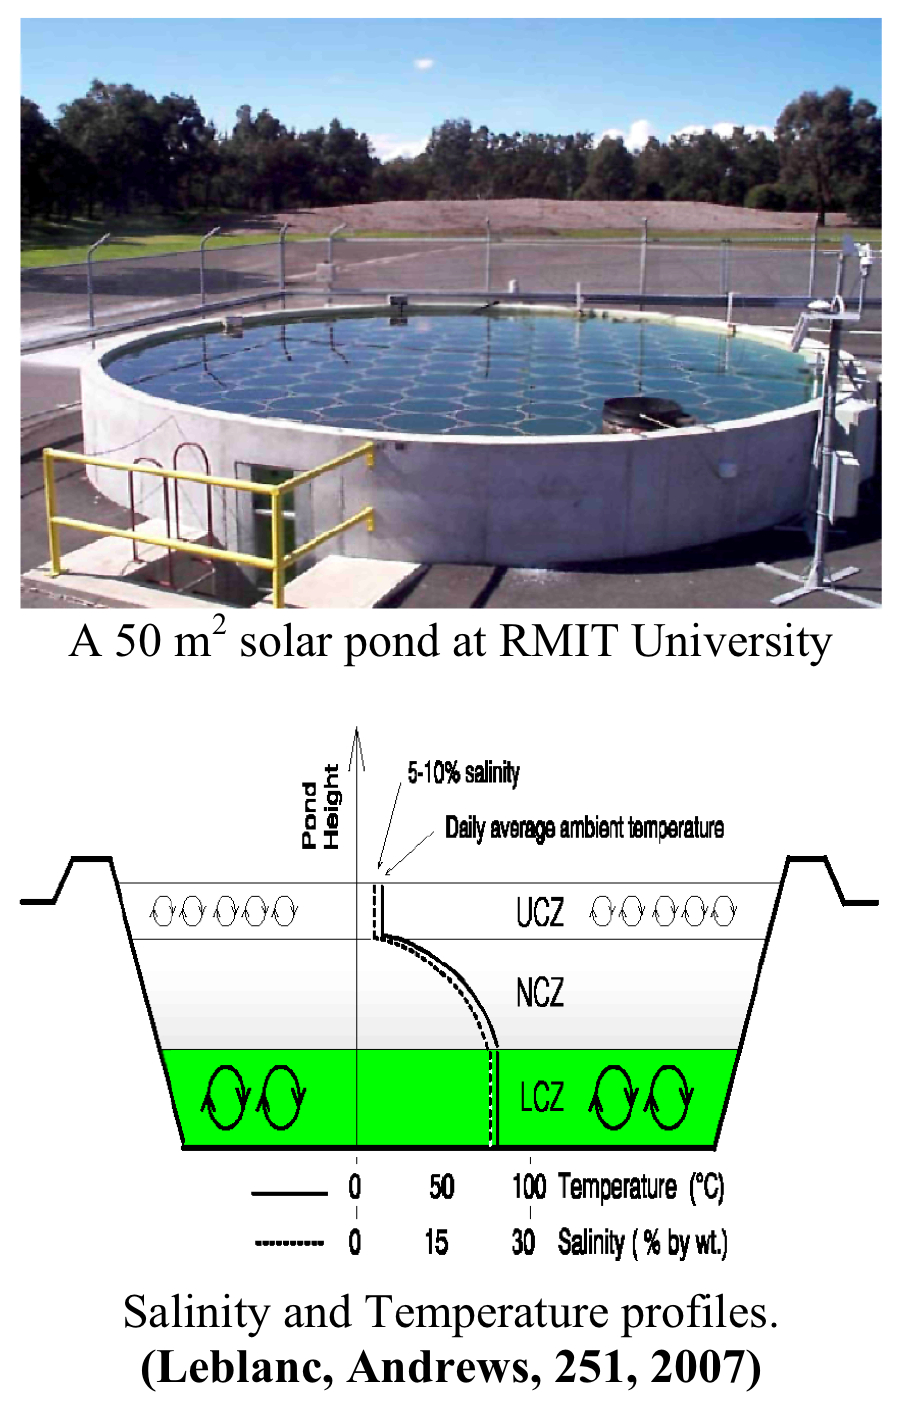
DesalinationAs we mentioned in our Colorado River problem statement, California uses more than a quarter of the Colorado River's total volume. In fact, more than 4 million acre-feet of the dwindling water source goes to California each year. (Interim Surplus Guidelines, 2001). Imagine if California supplied its own water and left a majority of those 4 million acre-feet where they belong in the river. Desalination may very well be California's answer to the drought in North America. This process boomed in California in the 1990s, when reverse osmosis technology freed desalination from the use of thermal energy. Originally, condensed steam was used to evaporate freshwater from seawater in processes known as multi-stage flash (MSF) and multi-effect distillation (MED), but their energy efficiency lagged in comparison to that of reverse osmosis. Currently, 85% of California's desalination facilities are reverse osmosis plants, (Cooley, Gleick, & Wolff, 27, 2008) which use fine membranes and pressure to separate salts from water. Desalination provides California with 50,000 AF annually, or ten percent of California's water needs, (Johns, Karajeh, 2, 2004) but is ideal for only certain communities. In 1992, construction of the Santa Barbara Desalination Plant was completed after a five-year drought in California. The facility was expected to produce enough water to compensate for severe loss in groundwater reserves during the drought. This $34 million project distributed water at $1.22/meters cubed, a rate significantly higher than normal. (Cooley, Gleick, & Wolff, 2008) In contrast, the initial rate for conventional water for a single family household in Santa Barbara today stands at $.24/meter cubed. (The City of Santa Barbara, 2008) Once the drought ended, however, the pricey facility was placed in an active standby mode, water prices rose in response to the cost of construction, and, as a result, water conservation methods encouraged citizens to save water and money. The plant has since been decommissioned, and although it has the capacity to process 12.33 million cubic meters of water(Cooley, Gleick, & Wolff, 2008), it stands as a reminder that no matter how great desalination may be for North America, financial costs prevent facilities from reaching their full potential. If the costs of desalination decrease, the west coast would have a viable water source in desalination, California could reduce its reliance on the Colorado River, and facilities would rarely meet the fate of the Santa Barbara plant. Because desalination is such an energy-intensive process, we focused our attention on the west coast of the United States, specifically California, where the state's proximity to the ocean cuts water transport costs and the community's "recycle and reuse" mindset acts as a foundation for desalination. Indeed, California has a great potential for desalination, but our solution may also apply to other regions severely in need of a renewable water source, such as Mexico. Our specific solutions are organized in a table at the end, with their effects outlined. EnergyIt is difficult to estimate the cost to maintain any given desalination facility for several reasons. First, the choice of desalination method is a large factor. Reverse osmosis relies heavily upon electrical energy whereas MSF and MED use thermal and electrical energy. Secondly, energy prices vary from location to location, further complicating calculations. Finally, estimates for a proposed facility are expressed in a variety of unrelated units, such as cost of water production or cost of water distribution. There is, however, one common denominator amongst all desalination facilities; energy is the largest determinant of cost. Specifically, 44% of the typical water costs in a reverse osmosis plant comes from electrical energy. (Cooley, Gleick, & Wolff, 2008) Thermal seawater plants use even more energy, with close to 60% of costs coming from thermal and electrical energy.(Cooley, Gleick, & Wolff, 2008). It is clear to see that cutting energy use will most directly cut costs to desalinate water, as opposed to cutting maintenance, labor, and fixed costs, which account for a smaller percentage of costs combined compared to energy alone. Co-locating power plants with desalination facilities and using renewable energy, such as solar and wind power, are two solutions that will significantly cut down on the energy requirement of desalination, thereby decreasing costs of desalinated water, making desalination a more feasible water source for the west coast of North America. Our goal also entails increasing the overall efficiency of desalination by putting membrane reject, or brine, to use. Co-location is recognized as a versatile, effective solution by the American Academy of Environmental Engineers. This method partners desalination plants with power plants, which then share energy and water. Approximately 18% of desalinated water is already used by power plants, and we hope to increase this ratio. (Cooley, Gleick, Wolff, 26, 2008) First, the discharged cooling water of the power plant serves as a water source for desalination. The salinity of power plant discharge is comparable to that of seawater and this water source passes through bar racks on its way to desalination, and so the need for separate pipelines and screening facilities is reduced. This alone decreases desalination costs by 5-20% (Voutchkov, 2008). Secondly, the concentrated brine may be safely diluted, reducing its impact on the environmental equilibrium downstream of the facilities. This has already benefited the 2800 meters squared Tampa Bay Seawater Desalination Plant, which dilutes its brine in a 70:1 ratio containing 1.4 billion gallons of cooling water from Tampa Electric's Big Bend power plant. (Tampa Bay Water, 2008). Even when desalination operation peaked, no significant change in salinity was detected. For more information on brine disposal, please see below. When considering an energy solution for desalination, renewable energy is key. Nations such as Australia and the Netherlands have already taken steps to incorporate wind and solar energy into desalination, and it is time for the US to follow suit. Many of the coastal regions in western North America are known for their high winds and clear skies and thus have a great potential to decrease reliance on electrical energy. Since 2000, RMIT University in Australia has studied solar ponds to power industrial processes such as desalination. These ponds maintain a salinity gradient that increases down the basin, which traps solar energy at the bottom layer where it is stored. In Pyramid Hill, Australia, the RMIT solar ponds take water to be desalinated through pipes on the bottom of a hot solar pond. As a result, the source water is heated and brought to a vacuum chamber to boil. This boiling desalinates the water and gives off heat as vapor condenses to warm incoming water. Eventually, the process produces freshwater at room temperature. (Maslen, 2007) It has been found that solar ponds distribute energy at $10-15/GJ in an area where electrical energy costs up to $45/GJ at peak hours and as low as $9/GJ at off-peak hours. (Annand, 2008) On average, solar ponds are therefore a more economical source for energy than electrical energy, desalination's main source of energy. Since a solar pond is a horizontal, open-top surface, evaporation may result in water loss. We propose to add wind breaks around all solar ponds, which will cut down the amount of wind skimming over the surface of the basin. The size of the pond must also be taken into consideration. For example, the 50 meters squared solar pond at RMIT may be used for space and water heating whereas a 7000 meters squared pond in Israel provides 150kW (Mother Earth News, 1980), which would provide about a fifth of the energy for the 109 meters squared Chevron Desalination Plant in Gaviota. Another simple use of solar energy in desalination comes from solar stills. There are many forms and shapes of solar stills, also known as distillation stills, but all have the same function. A water cycle is created within panes of glass when the sun evaporates seawater input, water vapor condenses on the underside of the glass, and is guided into troughs as freshwater. As opposed to solar ponds, solar stills come with the advantage that there is no concern for water loss through evaporation, (SolAqua LLC, 2008) but its productivity depends on ambient temperature and sun intensity. In the southwest, a still can produce as many as 6 liters of water per day. This rate is geared towards individual, not communal, needs, so the scalability of solar stills must be addressed. It has been estimated that every 2 meters squared of still area serves one person, so we propose to use a 5000 meters squared area worth of solar stills, taking up less space than a football field, in a small, dry, mainland community to test the scalability of distillation. Note that we decided to use many stills rather than one large still. This will ensure a more efficient capture of water vapor and thus freshwater. Solar distillation has been found to eliminate biological contaminants as well as arsenic by the National Sanitation Foundation, and so it is a viable source for low demands of drinking water. That said, we found our solution involving solar distillation technology to be most appropriate for the San Nicolas Island and Santa Catalina Island desalination plants. Both plants serve a small population that is isolated from mainland water, and so solar stills would act as a quick fix to sudden droughts. Additionally, the Santa Catalina Island plant operates at 27% efficiency, (CA Coastal Commission, 2008) which means only about a quarter of the water input is distributed as freshwater. Solar stills would be a simple way to boost the island's product recovery. It is important to note that solar stills cannot replace desalination plants. Instead, we hope to supplement desalination with distillation, thereby decreasing the environmental impacts and costs of desalination for these small regions. Wind energy is most appropriate for hilly sites and valleys, which would act as funnels for the wind power plant. Hilly sites do not house efficient desalination plants because a large amount of power, calculated from the conditions of the situation, is required to lift water over the hills. For example, close to 36,000 watts are required to transport water moving at 29.5 gallons per minute uphill 100 feet at 3 feet per second through a mile-long pipeline with a 2-in. diameter. (Hoffman, 2003) However, valleys not only funnel wind, but also water straight to facilities without extra energy. This is why we are focusing on the coasts for our desalination solution. The valley of southern California is home to many desalination facilities for this reason, too, and we propose to add wind as a source of energy to the Chevron Oil and Gas Processing Plant in Gaviota and the proposed Ventura and Metropolitan Water District of Southern California Desalination Plants. Researchers of the Netherlands' University of Delft have designed a windmill that would drive the high-pressure water pump, which cuts down energy lost by converting wind to electrical energy and then to mechanical energy. With this method, each windmill would produce 5-10 cubic meters of freshwater per day (Heijman, 2008), thus supplying enough water for an entire household. It's a small start, but wind energy has many advantages over solar power. First, it is a more productive source of energy to desalinate water. A case study in Eritrea found that wind-powered facilities produce up to 4000 meters cubed/month whereas solar-powered facilities reached 1500 meters cubed/month. Wind energy is also praised as the cheaper energy option, with water costs hovering around $.5/meters cubed, while solar-powered desalination produces water at a charge as low as $.8/meters cubed.(Gilau, Small, 2007). Brine DisposalBrine, or the high-salinity concentrate that is removed from water during desalination, has traditionally been deposited in landfills or oceans, but this is not an environmentally viable plan for the next 100 years. The TDS, or total dissolved solids, concentration for brine is at least 36 kg/meters cubed.(Younos, 2, 2005) Simply dumping the brine into the ocean, as is tradition for some facilities, will wreak havoc for organisms living in the water that may be accustomed to the homogenous conditions of the water. Not only does brine have environmental impacts, but also efficiency issues. For every 100 gallons that enters a desalination plant, only 15-50 gallons exit as freshwater, (Cooley, Gleick, & Wolff, 2008) while the remainder consists of brine. If we defined desalination efficiency as the percentage of products used, we hope to use brine so desalination's efficiency increases to over 75%. In fact, brine may play an important role in our aforementioned solutions. As discussed earlier, co-location with power plants eliminates the need and cost for new intake pipelines. In this scenario, brine is typically discharged into a cooling water pipeline, which pumps the dilute solution into an injection well. Leaks from these wells bring a risk to the water quality of nearby underground aquifer, and so land application of brine is a safer approach. A common tool for brine disposal is an evaporation pond. Evaporation ponds work well in arid areas, such as the west coast of America, because they collect concentrate in a basin as water in the brine evaporates. There are currently no evaporation ponds in California used for brine disposal, and we believe this solution will eliminate the need for further discharge lines and facilities and provide salt processing factories with a harvest of sodium chloride. The salt could then be used for industrial processes such as the manufacture of glass, the production of detergents, polymer production, tanning, aerospace alloys, effluent neutralisation, metal refining, sugar extraction and cement manufacture. (University College Worcester, 2000) For these reasons, we would like to add double-lined evaporation ponds to open areas where populations would not be disturbed. Specifically, we are looking at the desalination plant in Morro Bay and the Hearst San Simeon State Historical Monument plant because the population is approximately 50-99 people per square mile compared to Los Angeles County, where the population reaches tens of thousands of people per square mile. Additionally, these two plants are located nearby two power plants. Co-location coupled with the use of evaporation ponds in California decreases desalination's impact on the ocean and increases the efficiency of desalination. Environmental IssuesCritics of desalination are quick to point out that this process may pose threats to the environment, but our solutions were chosen specifically to help combat the environmental issues resulting from desalination. When brine is excessively emptied into the ocean, sensitive organisms such as sea urchins and precious habitats such as coral reefs can be harmed. We recognize that in areas where there is no space for an evaporation pond or seawater disposal is more feasible, brine disposal has the lowest effect on nature in areas of rocky, sandy shores since brine will sink down rather than mix and coast-parallel currents to sweep the brine away. Additionally, we will strive to avoid disposing of brine in area near salt marshes, coral reefs, and mangrove flats. This means that any desalination plant near San Francisco Bay, such as the proposed Marina Municipal Water District desalination plant, should use evaporation ponds to cut down on the amount of brine being put into to ocean and further co-location with the Portrero Unit 3 thermal power plant to water down the brine that actually does enter the ocean. In fact, this concern is one reason why the Monterey Bay Desalination Plant is co-located with the Aquarium, which happens to be the largest of its kind in the US. To further avoid contamination, we also would like to see the construction of a new salt processing plant that would put the brine to industrial uses. Ideally, this new plant would be located south of Moss Landing and Monterey Bay, where it would not disturb a large population and where there is a need for continued environmental stability. Desalination has been found to add up to 25kg of carbon dioxide to the atmosphere per meter cubed of water produced. (Water Week, 2007) In a time of increased awareness of global warming, we know that our solution has to combat greenhouse gas emissions. We also strive to disturb communities as little as possible. Our use of wind energy will both help the environment and the community because it has been proven to decrease carbon dioxide emission while operating quietly. According to our calculations, 1500 kWh of energy will be produced per year for every 1 kW per turbine. Wind can provide energy at a rate as low as $.05/kWh. (American Wind Energy Association, 2008) To put this in perspective, the Chevron Desalination Plant in California, a proposed site for wind turbines, requires 6.9 million kWh/yr. This particular reverse osmosis facility has a capacity of 460 AF per year and the operation costs come to $4000/AF. (Frum, 2008) Using these numbers, the total cost for desalination at this plant would be $1.8 million/yr. If all of the energy required to run the facility was provided by the wind, the energy costs would only come to $345,000. These savings, as well as those from using wind energy at the Ventura and Metro Water District of Southern California desalination plants, will stop millions of pounds of gases from being released into the atmosphere. Solar energy, much like wind energy, will cut down on greenhouse gas emissions. The Santa Barbara desalination plant, which, as we mentioned at the beginning of our solution statement, has been decommissioned, is estimated to require 49.5 million kWh/yr (Frum, 2008) and would release 35,000 metric tons of carbon dioxide into the atmosphere annually. This is an extreme case, but it shows just how careful we have to be when proposing desalination as a solution. Our use of solar ponds and solar stills acts as a supplement to desalination, not an alternative. The Yuma Plant
(Dibble, 2008)
Of course, our desalination proposals may apply to areas other than California. As we explain on our International Solutions Page, Mexico currently receives water with a high salinity from the Colorado River, which therefore poses a threat to Mexican crops. The Yuma Desalination Plant on the border between Mexico and Arizona was originally designed to desalinate water drained from farm fields in the Wellton-Mohawk Valley, but was shut down after floods caused severe damage to the facility. Like the Santa Barbara Plant described at the beginning of this page, the Yuma plant's operation was put on hold. In 2007, researchers planned to test the facility, weighing Mexico's need for pure water with the associated costs. By several international agreements, the US has committed to supplying Mexico with a specific amount of freshwater each year. Inspired by this relationship, we imagine that the US should agree to restart the Yuma Desalination Plant, thereby partially fulfilling their water duty to Mexico. Solar ponds and wind turbines would be appropriate additions to the plant, as they would not disturb a very large population. As of October 2008, Arizona, Nevada, and California have entered negotiations and decided to split the plant's first year costs. Additionally, the plant's estimated 10 billion gallons of annually desalinated water would be split to the three states. (McKinnon, 2008) This, however, leaves Mexico out of the picture, so we would like to see California's share of Yuma's freshwater enter back into the Colorado River for Mexico. This is a solid solution for two reasons. First, if adopted, our solutions would supply California with just as much, if not more, freshwater than the Yuma plant, thus decreasing the Golden State's reliance upon Arizona's facility. Secondly, California would avoid the cost of transporting the water hundreds of miles, which has already been proven to constitute significant energy savings. ConclusionFor the next 100 years, these solutions will significantly decrease the energy use, and therefore cost, of desalination in the west coast of North America. Once the price-tag of desalinated water becomes reasonable, more facilities will be able to run at full capacity throughout California. Four of the desalination facilities in California currently listed as "inactive," "intermittently used," or "decommissioned" consist of the City of Morro Bay plant, the City of Santa Barbara plant, the Marina Coast Water District plant, and the Santa Catalina Island plant. If just these four plants were revived as a result of the drop in costs, we have calculated that just over 14,000 additional meters cubed of new freshwater would be produced each day in California. This is enough to supply the water needs of 20,000 average Californians each and every day. Of course, it will take time for the benefits of this solution to take root. The use of wind energy will most likely be the first change to take place, as construction of each wind turbine should last no more than two weeks. Then solar energy will begin to play its part, as our "every drop counts" solution of solar ponds and stills collects energy and a backup supply of water. Finally, our long-term application of co-location will take on remaining energy requirements and environmental issues.
Estimated Funds Saved: Note: It is important to remember that the estimated funds required is only an estimate and shows that over one-quarter of the funds required will already be provided by savings in energy. We found daily solar still production to be 3-4 Liters. Cost for solar ponds estimated using http://www.enersalt.com.au/Local%20Publish/html/cost___ value.html. To calculate the amount of energy saved with wind energy, we multiplied the number of kW per turbine by 1500 kWh/yr, the amount of energy we estimated each kW of turbine to produce. This estimation arose from our observations of several wind turbines. To find the amount of carbon dioxide emissions, we used http://www.epa.gov/clean energy /energy- resources/calculator.html. To calculate the new cost to maintain the plant after installing wind turbines, we created a very simple formula: New Cost=cost for wind energy + cost for remaining electrical energy=.05(Ew) + X(Etot-Ew) where .05 is the cost, in $/kWh, of wind energy, Ew is the energy produced by wind, Etot is the original amount of energy required by the facility, and X is the facility's $/AF rate divided by its kWh/AF rate to calculate the $/kWh rate. | ||||||||||||||||||||||||||||||||||||||||||||||||

|
|