Overview
Opening a new mine is an expensive, time-intensive process. Most mines must operate for years to cover initial start-up costs; therefore, they are only opened after careful market analysis. In the case of the rare earth elements (REEs), there has only recently been a significant increase in REE usage, and the mining industry has not yet increased production to meet this demand. In order to meet demand for the next hundred years and beyond, the amount of REEs mined will need to increase significantly.
Though for all practical purposes these elements will never "run out," it will quickly become so expensive to produce them that the supply will be unable to meet consumer demand. There are two methods of countering this looming problem: reducing consumption and increasing supply. The recycling page and alternative technologies page explain solutions which will help reduce consumption, and we shall now look at solutions to increase supply by opening new mining operations.
New Mining Operations
Listed below are Mission 2016's recommendations for opening new mining operations in order of least to most pressing need.
Uranium and Thorium
Uranium is critical to the nuclear energy industry as a fuel for nuclear reactors, which provide 12.3 percent of the world's energy ("Nuclear energy around," 2012). Fortunately, provided that the world's current rate of exploration and mining will grow as it has in the past, there should be a stable supply of uranium and thorium for at least the next 80 years ("Supply of Uranium", 2012). However, this estimate does not take into account an increase in the global use of nuclear power, which would otherwise shorten the timeline for uranium to only about 60 years. We can meet the reduced supply first through recycling of uranium from critical element stockpiles (see the stockpiling page). Another method of reducing uranium consumption is incorporating thorium into nuclear reactors. Thorium-232 cannot be used alone because it is not fissile, but when mixed with uranium-235, it becomes fissionable uranium-233, which is then used to produce energy with significantly less waste than uranium reactors (see fissile elements supply and demand page) (Katusa, 2012). This incorporation is being done in only a small number of reactors around the world. Thorium is in relative abundance in rare earth mines and is three times more abundant in nature than uranium and does not require enrichment before being utilized (Katusa, 2012). Utilizing it to its fullest extent will maximize the lifespan of nuclear energy by allowing a more abundant, more efficient, and safer fuel to be utilized.
Platinum group elements
Provided that mining continues at its current rate, reserves of platinum group elements (PGEs) are sufficiently abundant and concentrated that they are not projected to run out in the near future. For example, the Bushfeld Complex in South Africa which provides over 70% of the world's PGE resources, has been predicted to have enough supply to satisfy global demands for up to a century (Mudd, 2012). Additionally, the annual production of platinum from this mine is only about 1.5% of available platinum for each 1 km of depth (Cawthorn, 2010). However, problems with supply may arise from the political and social conflicts in the mining regions, particularly in South Africa, which has 80% of the world's PGE reserves (see PGE Supply and Demand Page) ("South Africa's Mining Problems"). A recent two month strike in South Africa from September until November 2012 is an example of one of the major problems which causes an uncertain supply at one of the world's largest mines. Although 12,000 workers have been rehired after the illegal striking and violence, the CEO of South African company Anglo American Platinum, Inc. was forced to resign. Another consequence of the strikes is that Anglo American and its subsidiaries have started to look into opening mines in Zimbabwe, which has also faced economic as well as workers' rights problems in the mining industry (Els, 2012). Finally, the second largest supplier of PGEs is Russia. Although Russia's mines supply significantly less platinum than those in South Africa, their production of palladium is greater than those in South Africa. This is important because palladium is able to substitute platinum in most uses (United States Geological Survey, 2012). Therefore, despite the unstable situation of platinum production in South Africa, there will be enough PGEs to satisfy their demand.
Phosphorus
Like PGEs, phosphorus reserves are concentrated in only a few locations worldwide (see Locations of Deposits page). If we consider only the current rates of use, the existing reserves will be sufficient for more than a century, however, current rates of use are projected to grow (Vaccari, 2009). Since phosphorus is a major component of fertilizers, which will be neceassary to increase crop yield to feed the growing population, demand for phosphorus is expected to increase with population growth. The rate of phosphorus being mined and used is expected to increase so much that reserves might only last 50 years (Vaccari, 2009). This is not so much a mining problem as it is a problem with waste and overuse. The only real solution to a phosphorus shortage will come through increased recycling and use of alternative sources, such as animal waste (see Phosphorus Conservation Page) (Vaccari, 2009).
Rare Metals (Ta, Nb, Co, In, Ga, Zr, Li)
The main problems associated with the elements tantalum, niobium and cobalt are global conflicts and social factors rather than a lack of mines (see the human rights & developing countries page). Indium-free technologies are in the process of pushing indium out of the market (for instance OLED's would replace LCD's, which use indium). Gallium and zirconium are primarily limited by the cost of their production rather than a need for new mines (see the rare metals page). Lithium reserves will be sufficient for the next century, so long as advances in processing meet the rate of demand for finished products such as lithium-ion batteries, removal technology improves, and new deposits are exploited (Gruber, 2011).
Rare earth elements
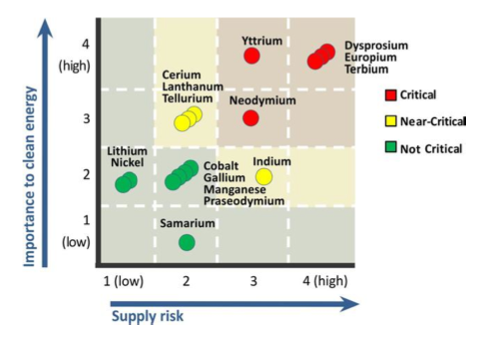
REEs are truly the only subset of elements with members which are facing critical supply projections for the near future. Alarmingly, projections from the US Department of Energy forecast that reserves of dysprosium and neodymium may run out by 2015 (Lifton 2011).
 As economic growth increases, devices which contain significant amounts of REEs (such as TVs, computers, cell phones and cars) will be in higher demand. The current rate of mineral exploration and mine opening may not be enough to keep up with this increased demand. Locations must be reinvestigated, reserves re-estimated, and new mines opened. As large mines like Molycorp's Mountain Pass and Lynas' Mt. Weld come online in the next year, demand for REEs may be met in the short term, especially for the more common elements like cerium. However, demand is still expected to rise at a higher rate than supply over the next decades (Gschneidner, 2011), so new mines will be needed in order to secure a stable supply of these materials. Another complication is the fact that China, which currently controls 97.0% of the heavy rare earth mining in the world (Hedrick, 2010), is in the process of reducing its exports (Lifton, 2011). New mines and refineries need to be established to provide a supply of these elements that is not dependent on just one country and its policies (see Refinement page).
Aside from the cost barriers to opening mines, there are safety (Bias, 2012) and environmental concerns ("Rare earth mining...", 2012) that must be taken into account. To increase yield and make mining less harmful for the environment, efforts must be taken to minimize the environmental footprint (see Green Mining page) and mining and environmental standards for mines must be either instantiated or more strictly enforced so that mines are held responsible for their effect on the surrounding area (see the solution page for environmental harms of mining).
In the long run - 50 years from now and beyond - recycling (see the recycling page) and alternative technologies (see the alternative technologies page) will help to decrease dependence on REEs and take the pressure off of mining operations. This does not change the fact that mining will continue to be the primary source of strategic minerals and must be carried out in an efficient, environmentally-sensitive manner.
Implementation
Opening a mine is not a simple task. There are many factors and costs that need to be taken into account (see mining background). Once all the necessary requirements have been met or taken into consideration, new mines can be established.
Opening New REE Mines
The technology to mine and refine REEs from bedrock deposits only became available in the 1960s. Before then, only placer deposits, which are created from density sorting by water currents, were used for mining REEs. (Leifert, 2010) The denser materials tend to accumulate in one place because it takes more energy to move the dense minerals. Monazite is the main mineral containing REEs in placer deposits although xenotime is also found in placer deposits as well. The first bedrock REE mines were established in Mountain Pass in California, Lovozero in Russia, and Steenkampskraal in South Africa. China began establishing REE mines within its borders a few years later. (Orris, 2002)
The locations of major REE mines have not changed drastically over the last 50 years, but have expanded locally as more deposits were discovered in the vicinity of current mine locations (see Locations of Deposits page). There are currently more than 400 projects related to rare earth exploration outside of China ("Rare Earths"). Interest in REE mining has likewise increased: feasibility studies are ongoing at 40+ new sites being evaluated in the US, Canada, Australia, India, Malawi and South Africa (Schuler 2011, Werdon). The U.S. Geological Survey has data showing that there are significant deposits of rare earth material in China, the U.S., Russia, Australia, Brazil, Canada, South Africa, Greenland, India, Malawi, and Malaysia (Bauer, 2010).
There are 45 possible locations to mine where ore grade is estimated at 2% or higher, a percentage cut off many companies are currently mining at large scale (Bauer, 2010). These locations can be seen in the following map. To see the data for each point on the map, click the green dot.
The large REE mining operations are located primarily in China, although four other mines are also operating in Russia, the U.S., India, and Australia. Additional REE mines are up-and-coming, but the world does not yet rely on these mines for supply. The number of open REE deposits may also be due to the relative newness of the market for REEs. The profit to be gained from a mine can be modelled by a company through its feasibility studies, which determine profit based on ore grade of the rare earth oxide (REO), the amount of REO in a location, various costs of establishing the mine/obtaining permits, and the market price (due to demand) for the elements being mined. Refining costs must also be taken into account, since most refineries for REEs have to be built in conjunction with the mine, due to the huge amount of ore that needs to be processed (see the refinement page), and the high transportation costs these huge amounts of ore would incur. Based on the ore grade estimates and sizes, companies should send in prospectors to reinvestigate these sites and set up new mines when deemed profitable.
Some sites (in Brazil particularly), which contain up to 60% estimated rare earth oxide ore (REO), have estimates from as far back as 1984 (Bauer, 2010). These estimates must be revised and updated (see the locations of deposits page).
Based on current estimates of ore grade (>.1 million tons REO monazite (except in the case of Guarapari, where the REO concentration is very high)), the sites listed below should be the primary candidates for potential new REE mines, as they contain the most profitable sources of REO. While undergoing investigation, the factors of environmental, health, safety, community and monetary impact should be taken into account. The most plentiful but yet untapped sources of REE deposits are located in eastern Brazil and western Australia. Some sites may need to be mined in conjunction with other materials like titanium or nickel, as is currently common practice. For example, rhenium is only mined in conjunction with copper as a byproduct of molybdenum; there are no rhenium only mines (Magyar, 2007). Not all sites have a listing for the amount of ore, and these numbers must be determined before feasibility studies can begin. As demand pushes prices for these minerals up, it would become more economically feasible to look into mines that only contain a low tonnage of REOs, or a small orebody percentage (Bauer, 2010).
*Mt = millions of metric tons, estimated
t = tons
mon = monazite, a major mineral source of REEs
| Country | Name of Mine | Measured Reserve Estimates |
| Brazil | a) Anchieta (Parati, Imbiri, Pipa de Viho, Mäebá) b) Aracruz c) Guarapari d) Prado area e) Sao Joao de Barra (Barra Sao Joao) |
a) 698 t mon grading 60.02% REO (1986); 0.057 Mt @ 0.71% mon (1987) b) 2964 t mon grading 59.98% REO (1986); 0.282 Mt @ 1.05% mon (1987) c) 818 t mon @ 60.04% REO (1986); 950 t mon (1987) d) 4564 t mon grading 19.98% REO e) 8177 t mon grading 59.99% REO |
| Canada | a) Thor Lake b) Hoidas Lake |
a) 65 Mt @ 0.3% Ta, 0.4% Nb, 1.7% REE, 3.5% Zr; Proven-- 0.507 Mt @ 0.17% Y oxide, 1.11% Be oxide; 0.51 Mt @ 0.45% REO (1987) b) Grab samples contain ama 12% REE. |
| Greenland | Ilimaussaq | 6.6 Mt @ 6% ZrO2, 3% REO, 0.2% Y2O3 (1994); 30 Mt @ 0.9% Y2O3 (1990) |
| India | Ambadungar | 105 Mt @ 3% REO; 11.6 Mt @ 30% CaF2 |
| Kenya | Mrima Hill | 6 Mt @ about 5% REO (1966); 50.8 Mt @ 0.59% REO |
| Mozambique | Quelemane | 520 Mt @ 4.5% heavy minerals |
| Namibia | Ondurukurme Complex (Ondumakorume, Kameelberg) | 8 Mt @ 3% REO, 0.3% Nb2O5 |
| Russia | Tomtor | large resource with 8-31% REO, 3-8% Nb2O5 |
| Turkey | Kizilcaoren | 4.7 Mt @ 2.78% REE (1990) |
| USA | a) Wet Mountains |
a)13.96 Mt @ 1.0% REO (1989) b) 6.2 Mt (indicated resource) @0.09-0.46 % REO + 0.09-0.4% Y2O3 |
| Vietnam | Nam Xe South (Mau Xe North) | Proven + probable reserves-- 940 t REO; Possible reserves-- 3.0 Mt REO; average of 10.6% REO |
Source: http://pubs.usgs.gov/of/2002/of02-189/
Opening new rare metals mines
Elements like indium, gallium, and zirconium will only be mined if the price increases sufficiently for extraction to be economically feasible (these elements are present in such small amounts that it is only feasible to mine them in conjunction with other elements like zinc). Because the supply of tantalum, niobium and cobalt is complicated by factors other than mine production, Mission 2016 advises against opening new mines for these elements, and instead recommends addressing the political and social problems associated with mining of these elements. For lithium, if the rate of mine production continues at the same increasing rate it has been for the past decades, then the reserves are sufficient to meet demand for the next hundred years (Gruber, 2011). Recycling should continue - recycling rates are already at 90% for lithium (Gruber 2011) - and alternative technologies that decrease use should be considered for widespread application.
Opening new phosphorus mines: Locations of new phosphorus deposits are mostly located in high-conflict regions around the globe such as Algeria, Iraq and Syria (see the phosphorus problems page), where it will be difficult to establish new mines. The phosphorus deposits currently being mined will run out in the near future. However, reserves are large enough that companies can profitably mine for phosphorus in new locations like Morocco, which are currently not producing at full potential. In the long term, recycling phosphates, as well as looking for alternate sources, will be necessary strategies (see the phosphorus conservation page).
Opening new platinum group elements mines: PGEs are concentrated in only a few locations worldwide. The deposits in these locations should be sufficient for the next several decades, but could last longer with increased recycling efforts and decreasing use (Cawthorn, 2010).
Opening new uranium and thorium mines: Exploration and mining for uranium and thorium will continue until reserves run out, as companies seek to profit from demand for the element, which is projected to increase as nuclear power becomes a more popular fuel in the coming years.
Demand and Supply Relationship
Though demand for new supplies may be waning, in the coming century, new sources will be needed to meet increasing demand of elements for technologies like computers, hybrid cars and windmills. New mines are needed that meet consumer specifications, meet high safety and environmental standards, and use cost-efficient refining processes (for more information see the refinement page). Yet mining will only last as long as there is a demand for these elements. As long as demand for the elements increases, there will be a market from which new mines can profit (rare earths and yttrium).
Conclusion
In summary, more new mines are needed for REEs than for any other strategic elements. Projections for REE demand growth rates are high enough that the current mine production is not enough. Locations to look into include Brazil and Australia. For other elements, recycling efforts and reducing usage through substitutions or more efficient end-products will serve to stretch supply limits to meet increases in demand. In the long term, this should be carried out for REEs as well, so that new technologies are not dependent on such high cost products.
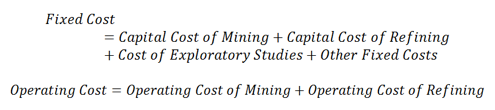
Cost Analysis
Opening a mine and separation plant can cost from $500 million to $1 billion, depending on the location, element, ore grade, and a variety of other factors (Schuler, 2011). Below is an economic feasibility analysis for opening new mines and refineries based on the price of the element (which is driven by demand for that element). Note that while this model is specific to REE mines, it can be applied to other kinds of mines as well, taking into account other factors such as production costs. Also note that the numbers used reflect costs typical of the industry, but may be uncertain due to assumptions that were necessarily made (listed below). The purpose of this analysis is to illustrate general trends of growth in the industry, not to provide concrete values.
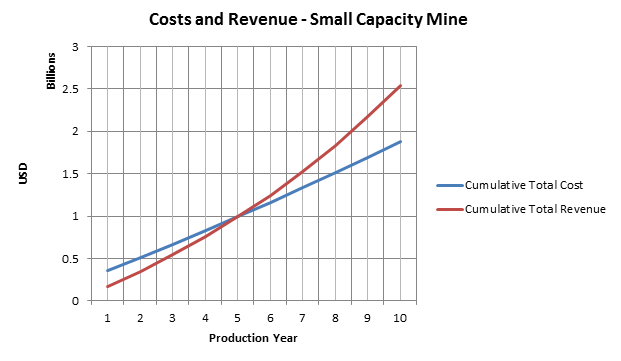
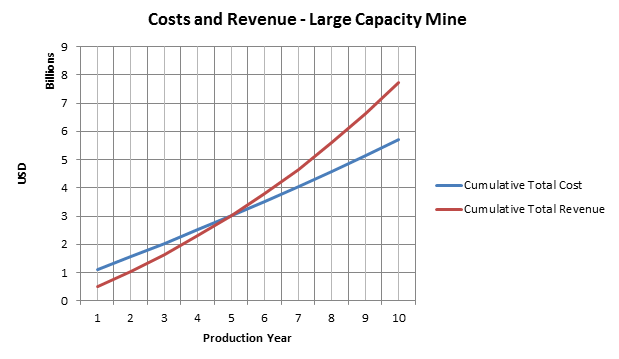
Twelve sites for potential mines and refineries were examined for economic feasibility of REE production. The potential mines were divided into two bins – small capacity mines and large capacity mines – by the expected output of REOs per year. Mines with expected REO outputs of less than or equal to 7000 tons/year were considered small capacity mines, and mines with expected REO outputs greater than 7000 tons/year were considered large capacity mines. For these calculations, small capacity mines were considered on average to produce 20,000 tons per day of raw ore and to operate 260 days per year with two 8-hour shifts per day, and large capacity mines were considered on average to produce 200,000 tons per day of raw ore and to operate 350 days per year with three 8-hour shifts per day. These assumptions were made out of necessity; no specific data is available for locations, so blanket values typical of the industry were used (Camm, 1991). Initial cost calculations were done separately for the two bins, but both used the following generalized model:
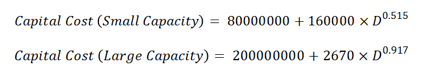
The capital cost of mining was calculated using the equations below, where D is the daily capacity of the mine in tons of ore produced per day. The constant (i.e., first) term in each calculation is a blanket estimate based on published average initial capital investment in the industry (~USD 500 million for what is defined in this analysis as a large capacity mine) (Schuler, 2011). To calculate this term, a constant capital cost of USD 400 million was used for large capacity mines. The calculation assumes that this cost is divided evenly into mining and refining, so the constant capital cost of mining becomes USD 200 million. For small capacity mines, 40% of the capital cost of the large capacity mine is used based on trends seen in the capital cost calculation for refining. The variable portion of the cost calculation is based on the open pit mining models published by the USGS, which take into account several factors that affect capital expenditures (Camm, 1991). From these, the following calculations were made:
The average operating cost per ton ore produced was also calculated using D:
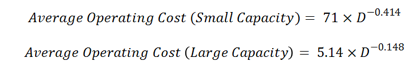
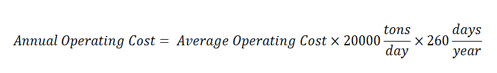
From this, an initial value for annual operating cost was calculated as follows:
The cost of refining was calculated using a correlation of 121 USD per lb of refined REE per minute for the solvent exchange method ("Increasing Metal Recoveries/Top-line Revenue"). A yield of 95% was used for these calculations (see the refinement page). The following equation was used:
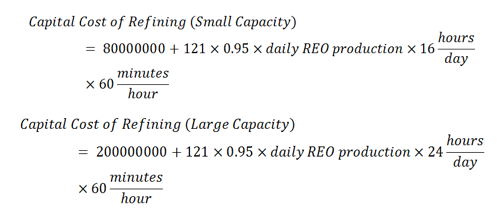
Note that this is a slight overestimation; the true capital cost of refining is based on the amount of refined REEs produced, the value for which is lower than daily REO production, as REEs account for only a fraction of the REO mass.
The cost of exploratory studies and other fees (legal, permit acquisition, etc.) was estimated to be 1% of capital costs to reflect the relationship between the scope of the mine and the preparatory costs of opening the mine (De la Vergne, 2003). Other fixed costs were considered to be miscellaneous expenses, and accounted for 0.1% of total fixed cost.
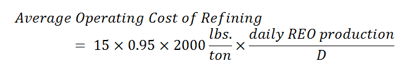
The operating cost of refining was calculated using the factor 15 USD/lb refined REE (Schuler, 2011). From this average operating cost of refining per ton ore was determined as follows, where D is defined as above:
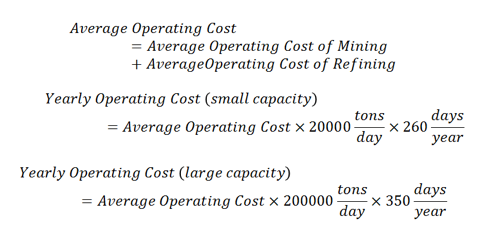
Then the operating cost per year were calculated from these as follows:
For each of the mines, the yearly production, total fixed cost, and yearly operating cost were input into a discounted cash flow analysis, which used a 2.64% annual growth rate for operating cost, 99.38% annual decay rate for production, and 10% growth rate for average revenue (price for a ton of REOs) (Lonso, 2012). The model does not take into account continuing capital expenditures, which are considered in the constant portion of the capital expenditure calculation.
These were used to calculate cumulative operating cost, cumulative total cost, cumulative production, cumulative average total cost, total revenue, cumulative total revenue, cumulative net revenue (profit/loss), and cumulative average net revenue. Initial values for average revenue were calculated assuming the company pays off the entirety of its initial investment the fifth year of production (cumulative net revenue = 0). The following graphs show the cumulative expenditures and cumulative total revenue over time, the difference of which gives cumulative net revenue. Note that this is not equivalent to operating profit; this calculation takes into account the initial capital expenditure.
For these projections, a minimum average entry price of REOs (USD/kg) was established for each of the mines to go into production. The calculation takes into account the average revenue (USD per ton of REO produced) required in the first year in order for the cumulative total revenue to equal the cumulative total cost of production - including the initial capital investment - in the first five years. This value is then divided by a conversion factor (907.185 kg/ton) to calculate the minimum average entry price. The results are given in the following table:
| Location | REO Output (t per year) | Entry Price ($/kg) |
Dubbo |
2850 | 41.74 |
Hoidas lake |
3000 | 41.03 |
Kangankunde |
5000 | 35.65 |
Steenkampskraal |
5000 | 35.65 |
Deep Sands |
5000 | 35.65 |
Nechalacho/Thor Lake |
6500 | 33.78 |
Manavalakurichi, Chavara, et al. |
7000 | 33.34 |
Mountain Pass |
15000 | 29.36 |
Mt. Weld |
15500 | 29.07 |
Nolans |
20000 | 27.14 |
Zandkopsdrift |
20000 | 27.14 |
Kvanefjeld |
25000 | 25.82 |
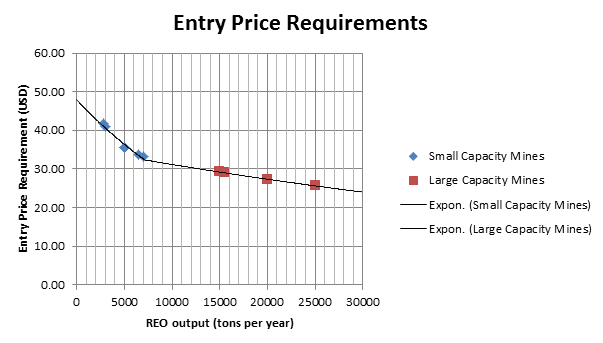
The above plot suggests a logarithmic relationship between expected annual REO output and entry price, and shows that the regressions are different for small and large capacity mines. This confirms the validity of treating the two bins separately for this analysis.
While it is difficult to quantify a real-world average revenue of REOs – this depends on the composition of the minerals mined, the market prices of the constituent REOs and REEs, the fraction of REOs refined to REEs, and the mass fraction of REEs –these results show that it is more economical for a large mine and refinery to open than it is for a small mine to open. At the same time, large mines and refinery face significantly larger barriers to entry due to higher costs associated with higher production rates. It is also well established that the developmental period for larger mines is longer than that of smaller mines (Schuler, 2011). It is apparent is that it is not only economically feasible but also highly profitable to open mines in the locations assessed. Still, this process will take a minimum of five to ten years to be set in motion. However, once this occurs, the market for REEs will become more competitive, prices will drop to reflect this. This renders mining an economic, private sector-based solution to the REE supply crisis.
The analysis thus far suggests that the mining solution to the problem of REE supply is entirely a free market solution – that is, no governmental interference is required provided that the market follows the logical course. However, it becomes apparent from a qualitative assessment of the current state of the market that the entities with the capital to establish mines are already the primary stakeholders in this industry, and would simply be expanding their operations. If this were to occur, then competition would not be increased. It is in the interest of the world market, especially nations aspiring to be developed, that competition in the REE market is promoted, as competition generally drives prices down. Therefore, it is in the best interest of governments to provide incentives, particularly monetary ones, to emerging companies aspiring to open mines in these locations, as this will increase the number of players, and subsequently the level of competition, in the REE market.
Timeline
Based on cost analysis, Mission 2016 projects the timeline for opening new mines to be as such:
By 2015: Bigger mines like Molycorp's Mountain Pass and Lynas' Mt Weld start producing at full capacity, increasing the amount of ore available by 56,000-57,000 tons ("Rare earths and yttrium"). Plans for new mines, both large and small, should be drawn up. Small mines in the aforementioned locations would be more feasible to have, with deposits in high concentrations but small amounts. Exploration of REE deposits continues for junior research companies. Research begins for new sources of phosphorus and possible substitutes for uranium. Research in recycling continues for PGE and some rare metals - alternative technologies also continue developing for rare metals, such as organic light-emitting diodes (OLEDs) instead of Liquid Crystal Displays (LCDs), which use indium.
By 2020: Larger mines will begin stopping production while new mines, both smaller and larger, should be be opening up. Investigation of deposits worldwide should continue, particularly for elements such as phosphorus, uranium and platinum, as these will be in higher demand in future years.
By 2030: Mining and establishing new mines should continue as projected. Exploration will continue as more mines are opened. Recycling and alternative technologies should begin to become a larger part of the strategic minerals market.
By 2050: Recycling should be at a capacity for REEs, rare metals, phosphorus and platinum such that supply is no longer solely dependent on mining. In addition, new technologies should have decreased usage of REEs and other strategic minerals. Exploration will have established a good estimate of reserves left for most strategic elements. Mining will still continue for REEs, though these elements will now be mined at a high enough capacity that competition has reduced prices for end-products containing these elements. This makes development that much more achievable for countries for which high-technology devices are currently out of the price range of most citizens (i.e., developing countries with a small middle class).
By 2070: Thorium will be used as a partial substitute for uranium in power plants, recycling rates will increase for strategic minerals across the board if they haven't already, and alternative technologies will be using fewer of these elements in their devices. Strategic minerals and their products should be available on the free market for any and all who choose to purchase them, at affordable prices for a middle class family.
By 2100: Supply comes mainly from recycling and alternative technologies, versus mining for strategic elements. A lack of strategic minerals is no longer a barrier of entry for an aspiring nation to be developed.
Bauer, D., Diamond, D., Li, J., Sandalow, D., Telleen, P., & Wanner, B. (2010). Critical Materials Strategy. U.S. Department of Energy. Retrieved November 5, 2012, from http://energy.gov/sites/prod/files/edg/news/documents/criticalmaterialsstrategy.pdf
Bias, J. (2012). Carroll's legacy is safer Anglo mines [Editorial]. Financial Times. Retrieved November 18, 2012, from http://www.ft.com
Camm, T. W. (1991). Simplified cost models for prefeasibility mineral evaluations. US Geological Survey. Retrieved November 19, 2012, from http://pubs.usgs.gov/usbmic
Cawthorn, R. G. (2010). The Platinum Group Element Deposits of the Bushveld Complex in South Africa. Platinum Metals Review, 54 (4), pp. 205-215
De la Vergne, Jack (2003). Hard Rock Miner's Handbook. Tempe/North Bay: McIntosh Engineering. pp. 54–65.
Els, F. (2012, November). South African platinum players turn to Zimbabwe. Mining.com. Retrieved November 20, 2012 from http://www.mining.com/south-african-platinum-players-turn-to-zimbabwe-30262/
Fox, Z. (2012). Our iPhones are depleting the earth's resources. Mashable Tech. Retrieved November 17, 2012, from http://mashable.com/2012
Gschneidner, K. A., Jr. (2011). The rare earth crisis: The supply/demand situation for 2010-2015. Material Matters, 6(2). Retrieved November 19, 2012, from http://www.sigmaaldrich.com/
Gruber, P. W., Medina, P. A., Keoleian, G. A., Kesler, S. E., Everson, M. P., & Wallington, T. J. (2011). Global lithium availability: A constraint for electric vehicles? Journal of Industrial Ecology, 00(00), 1-16. Retrieved November 15, 2012, from http://www.eenews.net
Hedrick, J. B. (2010). Rare Earth Industry Overview and Defense Applications (U.S., US Geological Survey). Retrieved November 19, 2012, from http://www.slideshare.net/RareEarthsRareMetals/rare-earthindoverviewsme2010#btnNext
Increasing Metal Recoveries/Top-line Revenue. (n.d.). Intellimet. Retrieved November 17, 2012, from http://www.intelligentmetallurgy.com
Katusa, M. (2012). The thing about thorium: Why the better nuclear fuel may not get a chance. Retrieved from http://www.forbes.com/sites/energysource/2012/02/16/the-thing-about-thorium-why-the-better-nuclear-fuel-
may-not-get-a-chance/
Leifert, H. Restarting U.S. rare earth production?. Earth magazine. June 2010. Pgs 20–21.
Lifton, J. (2011). The Rare Earth Mining Sector In 2015 And Beyond. Technology Metals Research. Retrieved November 20, 2012, from http://www.techmetalsresearch.com/2011/12/the-rare-earth-mining-sector-in-2015-and-beyond/
Lonso, E., Sherman, A., Wallington, T. J., Everson, M. P., Field, F. R., Roth, R., & Kirchain, R. E. (2012). Evaluating Rare Earth Element Availability: A Case with Revolutionary Demand from Clean Technologies. Environmental Science and Technology, 46(6). Retrieved November 21, 2012, from http://pubs.acs.org/doi
Magyar, M. J. (2007). Rhenium. U.S. Geological Survey. Retrieved November 20, 2012, from
http://minerals.usgs.gov
Mudd, G. (2012). Key trends in the resource sustainability of platinum group elements. Ore Geology Reviews, 46, pp. 106-117.
Nuclear energy around the world. (2012). Retrieved from http://www.nei.org/resourcesandstats/nuclear_statistics/worldstatistics/
Rare earths. (n.d.). UCore. Retrieved November 19, 2012, from ucore.com
Rare earths and yttrium: Market outlook to 2015. (2011). Roskill. Retrieved November 20, 2012, from http://www.roskill.com/reports
Rare-earth mining in China comes at a heavy cost for local villages [Editorial]. (2012, August 7). The Guardian. Retrieved November 18, 2012, from http://www.guardian.co.uk/environment
Schuler, D., Buchert, M., Liu, R., Dittrich, S., & Merz, C. (2011). Study on Rare Earths and Their Recycling (Issue brief). Retrieved November 10, 2012, from The Greens/EFA Group in the European Parliament website: http://reinhardbuetikofer.eu
Schweitzer, P. (2012). Rare earth element mines, deposits, and occurrences.
U.S. Geological Survey. Retrieved November 18, 2012, from http://mrdata.usgs.gov/ree/
Goren, A. (2012). South Africa's Mining Problems And Their Effect On The Price Of Precious Metals. Seeking Alpha. Retrieved November 19, 2012, from http://seekingalpha.com/article
Ulmer-Scholle, D. S. (2007). Uranium: How is it mined? New Mexico Bureau of Geology and Mineral Resources. Retrieved November 18, 2012, from http://geoinfo.nmt.edu
Supply of Uranium. (2012, August). World Nuclear. Retrieved November 18, 2012, from http://www.world-nuclear.org/info/inf75.html
Orris, G. J., & Grauch, R.I. (2012). Rare earth element mines, deposits and occurrences. U.S. Geological Survey. Retreived November 16, 2012, from http://pubs.er.usgs.gov/
U.S. Geological Survey (2012), Mineral commodity summaries 2012. U.S. Geological Survey, pp. 120-121.
Vaccari, D. A. (2009). Phosphorus: A looming crisis. Scientific American, (June), 54-59. Retrieved November 16, 2012, from http://web.mit.edu
Werdon, M. B., & Szumigala, D. J. (n.d.). Rare earth elements. Division of Geological & Geophysical Surveys. Retrieved November 15, 2012, from http://www.dggs.alaska.gov