| Vol.
XXII No.
3 January / February 2010 |
| contents |
| Printable Version |
Counting Faculty and Students
Every Academic Year, MIT counts the number of individuals holding appointments on October 31. This becomes the official MIT employee count. Likewise, the official count of students is based upon the number of individuals registered as of the Friday of the fifth week of the fall term. We use these census counts when evaluating the growth or decline of these populations from year to year.
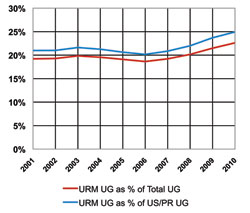
MIT, like all universities, follows the federal guidelines for collecting and reporting students and employees by ethnicity and race. For purposes of reporting, underrepresented minorities (URM) includes individuals who self-identify as Black/African American, Hispanic/Chicano, American Indian/Alaskan Native and, beginning with the 2009-2010 Academic Year, Native Hawaiian/Other Pacific Islander. The federal government also considers Asian as a minority race, but MIT does not consider it to be under represented. In the case of students, to be considered a member of a minority group, individuals must also be citizens or permanent residents of the United States. Individuals who are members of minority groups, but who are at MIT studying on student or other temporary visas, are counted as international.
(click on image to enlarge)
(click on image to enlarge)
(click on image to enlarge)
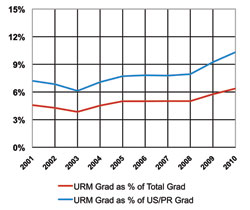
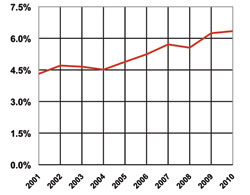
Charts 1-3 display the 10-year (Academic Years 2001-2010) trends for underrepresented minorities at MIT. The Undergraduate and Graduate Student charts display underrepresented minorities as a percent of the total student population and as a percent of the total number of citizens and permanent residents. The faculty chart displays the number of underrepresented minorities as a percent of the total faculty.
(click on image to enlarge)
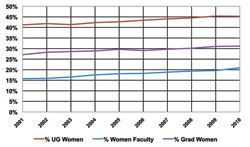
Chart 4 provides the trends for the number of women as a percent of the undergraduate and graduate student bodies and as a percentage of the total faculty. As with underrepresented minorities, all counts are based upon the fall fifth week count for students and the October 31 census for faculty.
(click on image to enlarge)
(click on image to enlarge)
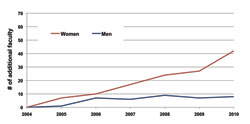
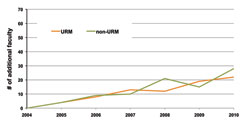
Charts 5 and 6 illustrate the net growth in the faculty by gender and URM since the 2004 faculty resolution requiring increased hiring of URM faculty. In AY2004 the faculty was comprised of 171 women and 804 men and in AY2010, there were 213 (+42) women and 812 (+8) men.
In terms of racial and ethnic diversity, in AY2004, there were 44 underrepresented minorities on the faculty and 931 Asians and whites. In AY2010, the faculty included 66 underrepresented minorities (+22) and 959 Asians and whites (+28).
| Back to top | |
| Send your comments |
| home this issue archives editorial board contact us faculty website |