


The city is a restless creature. It periodically feigns contentedness until some catalyst spurs it into another metamorphosis. These catalysts present themselves in many forms: the Depression, the invention of the streetcar, the addition of a population, the work of a family. While much of the city of Boston has been shaped by the grander of these events, my site has largely withstood such changes. Instead, the stories of the North End have been moved (and maintained) most noticeably by forces on smaller, communal scales, though global and national events in the always remain quietly evident. The most noticeable of these forces was that of cultural influx: immigration and the respective skills, demographics and socio-economic foibles associated with such processes heavily redefined the North End. The site has undergone major shifts in wealth and in turn in quality of buildings and infrastructure; despite its rougher past the North End has emerged as a mercantile and cultural centre of modern downtown Boston.

Walking the city out of its early days
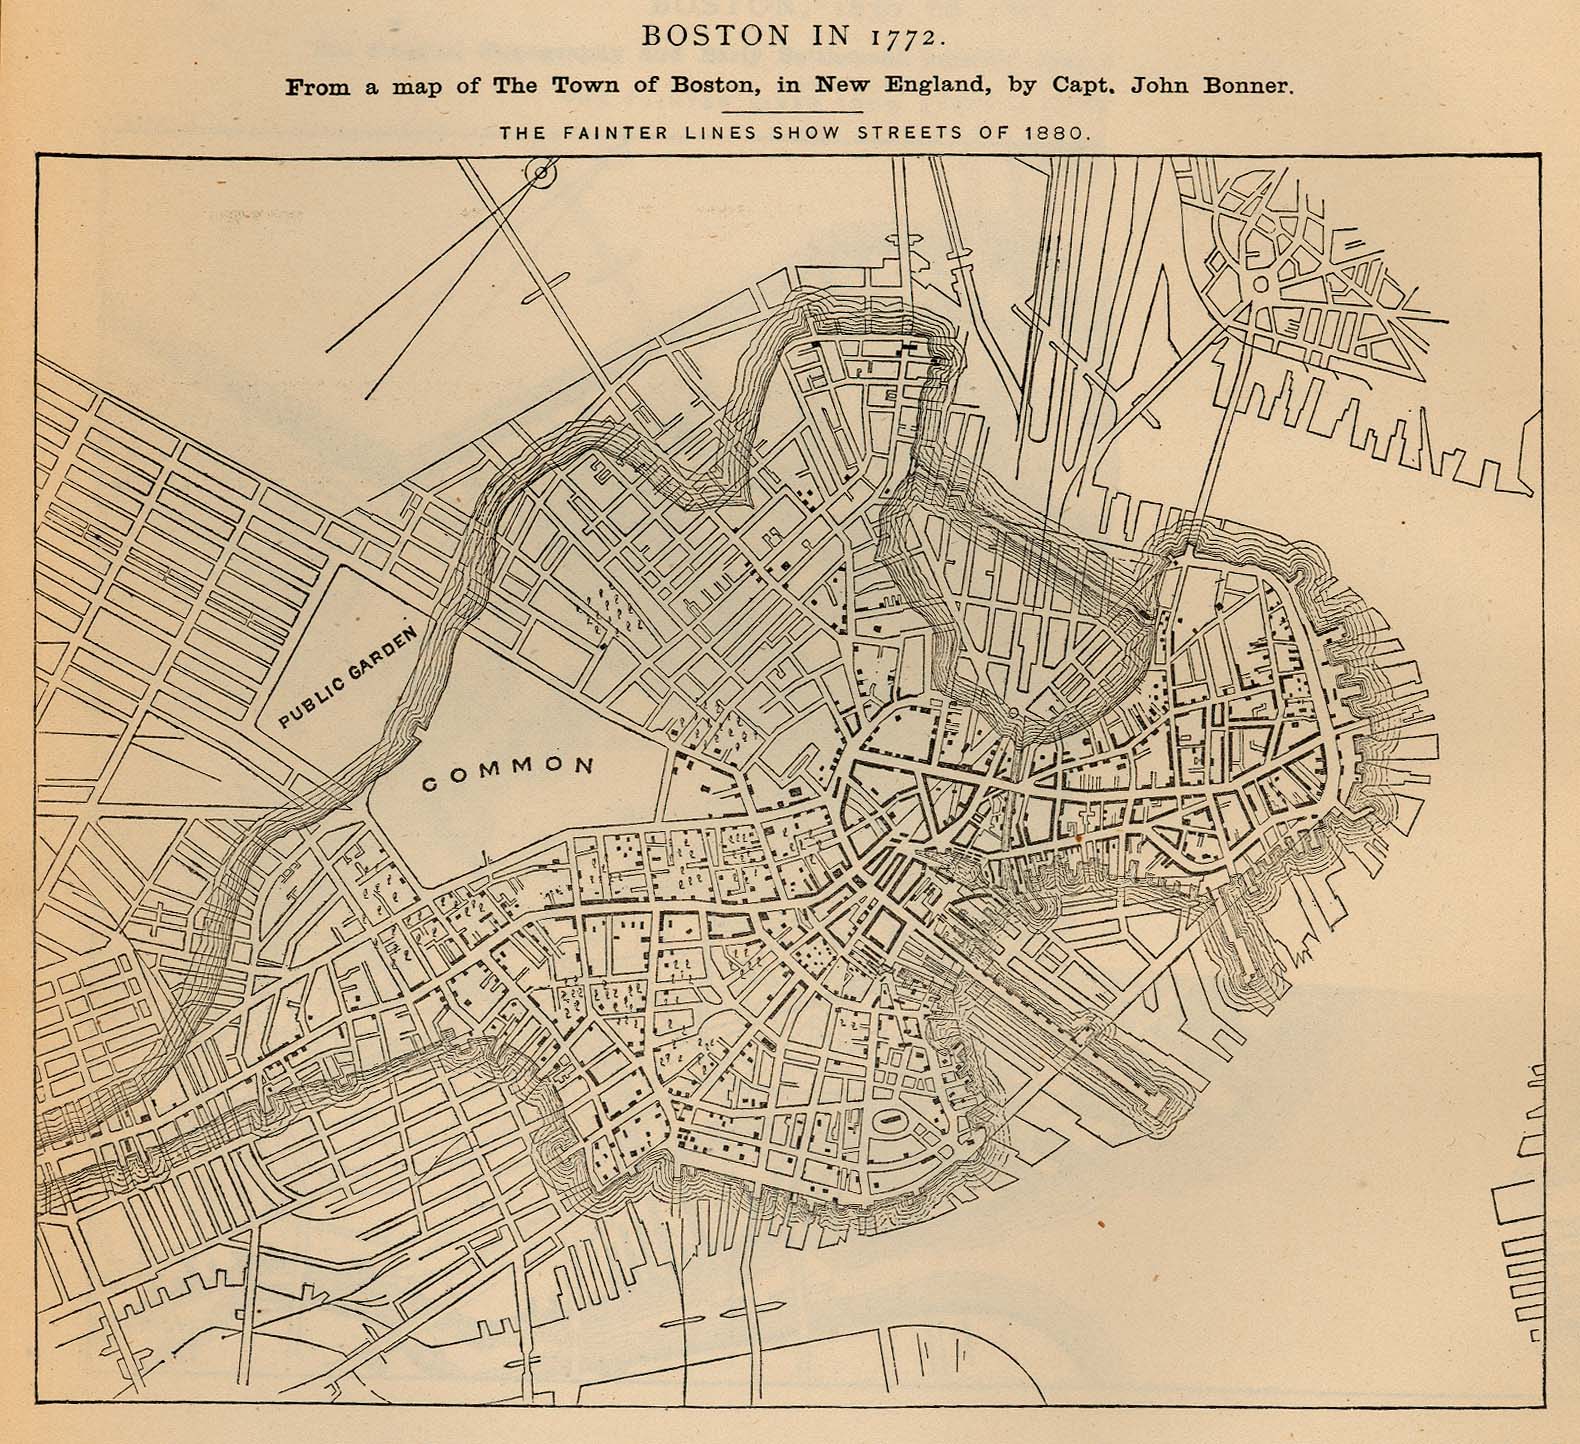
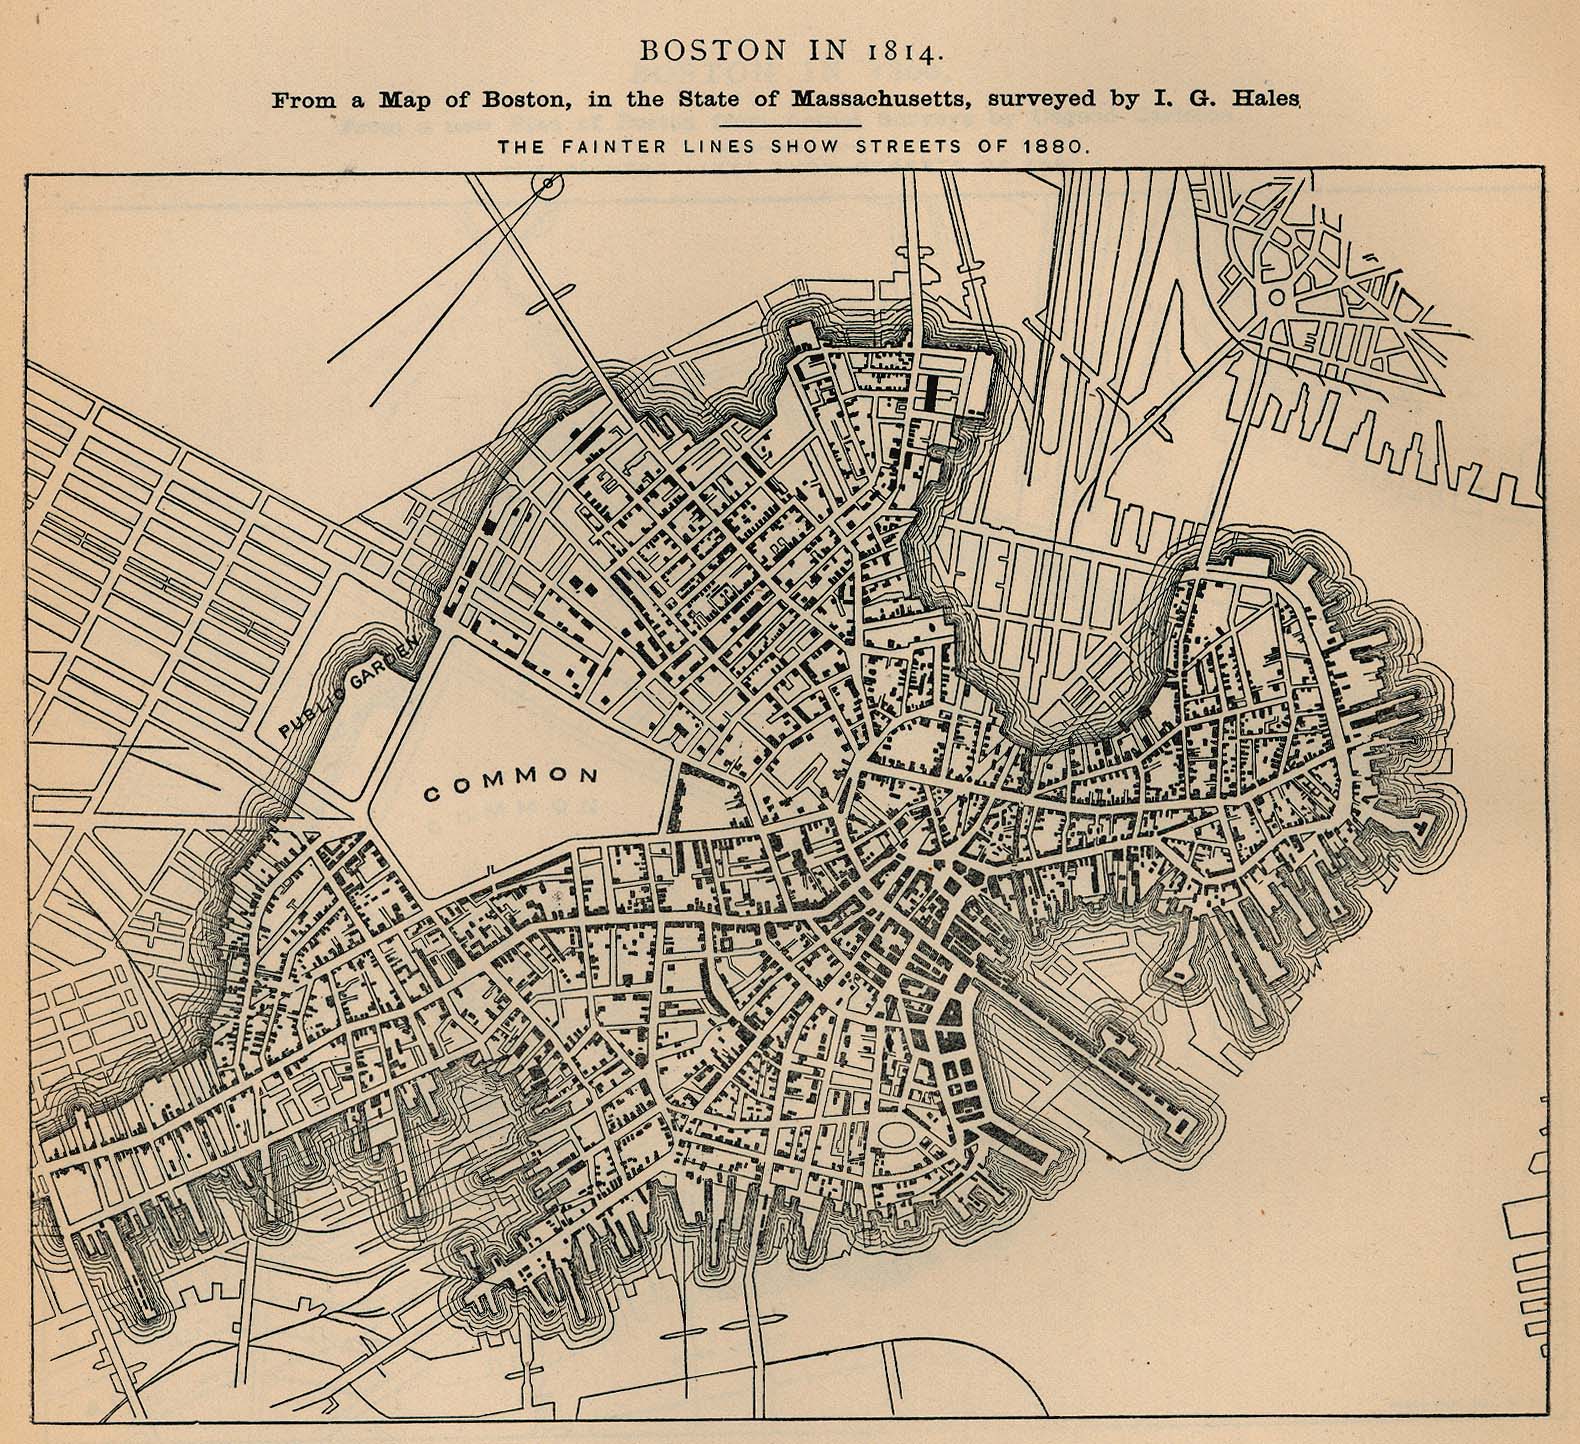
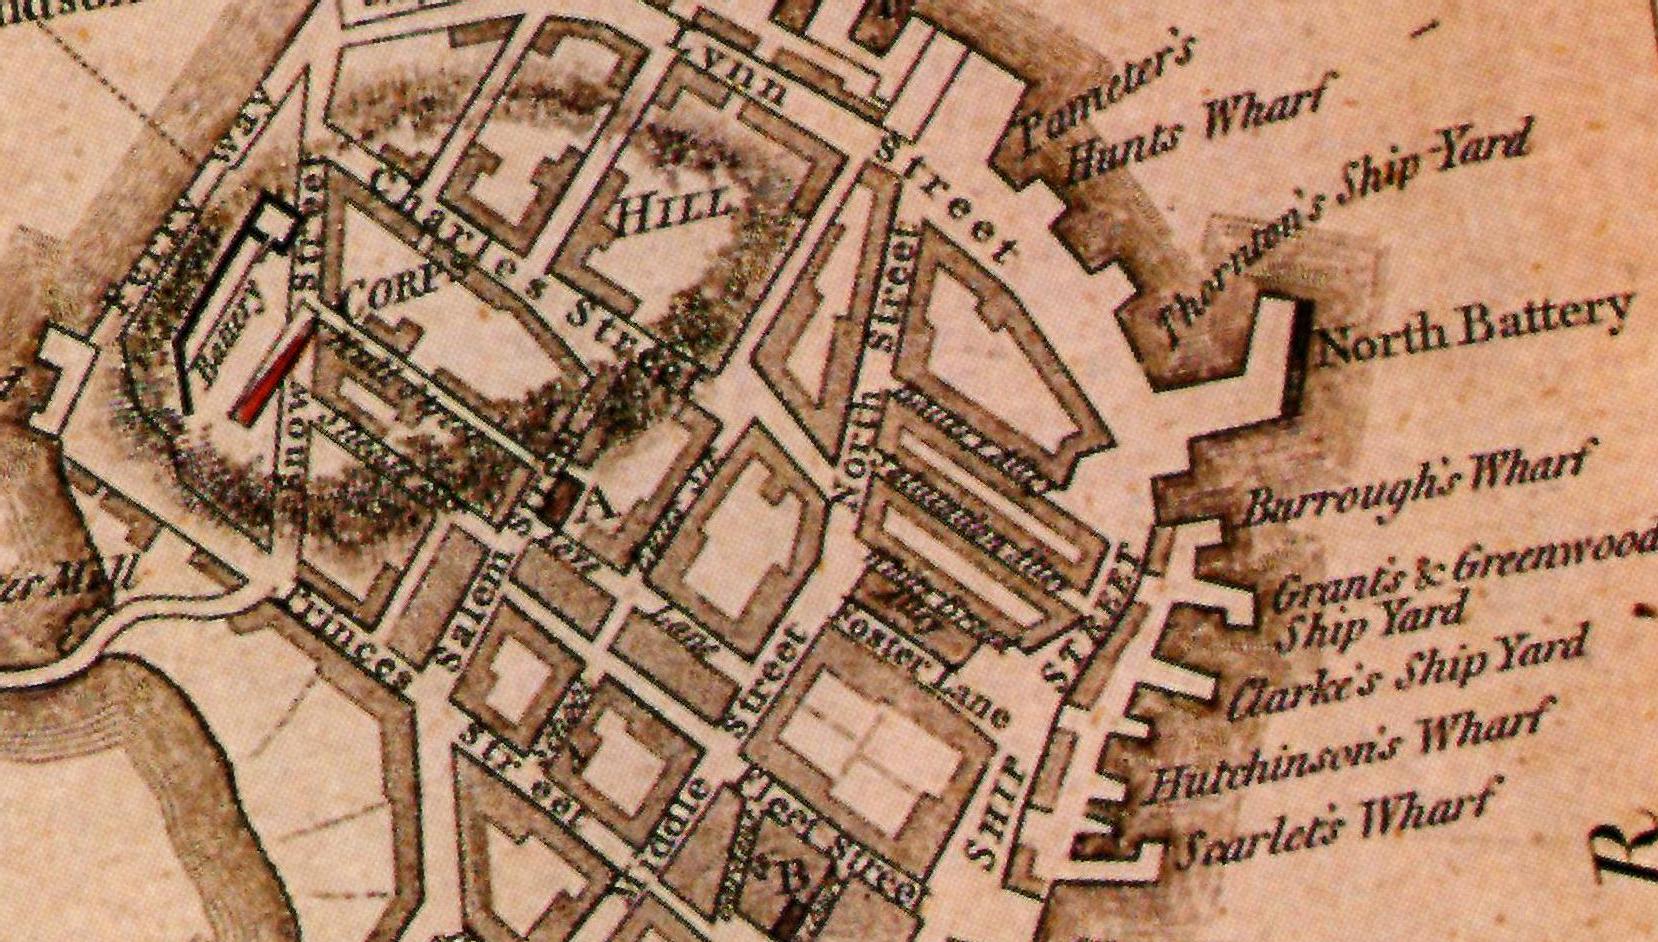
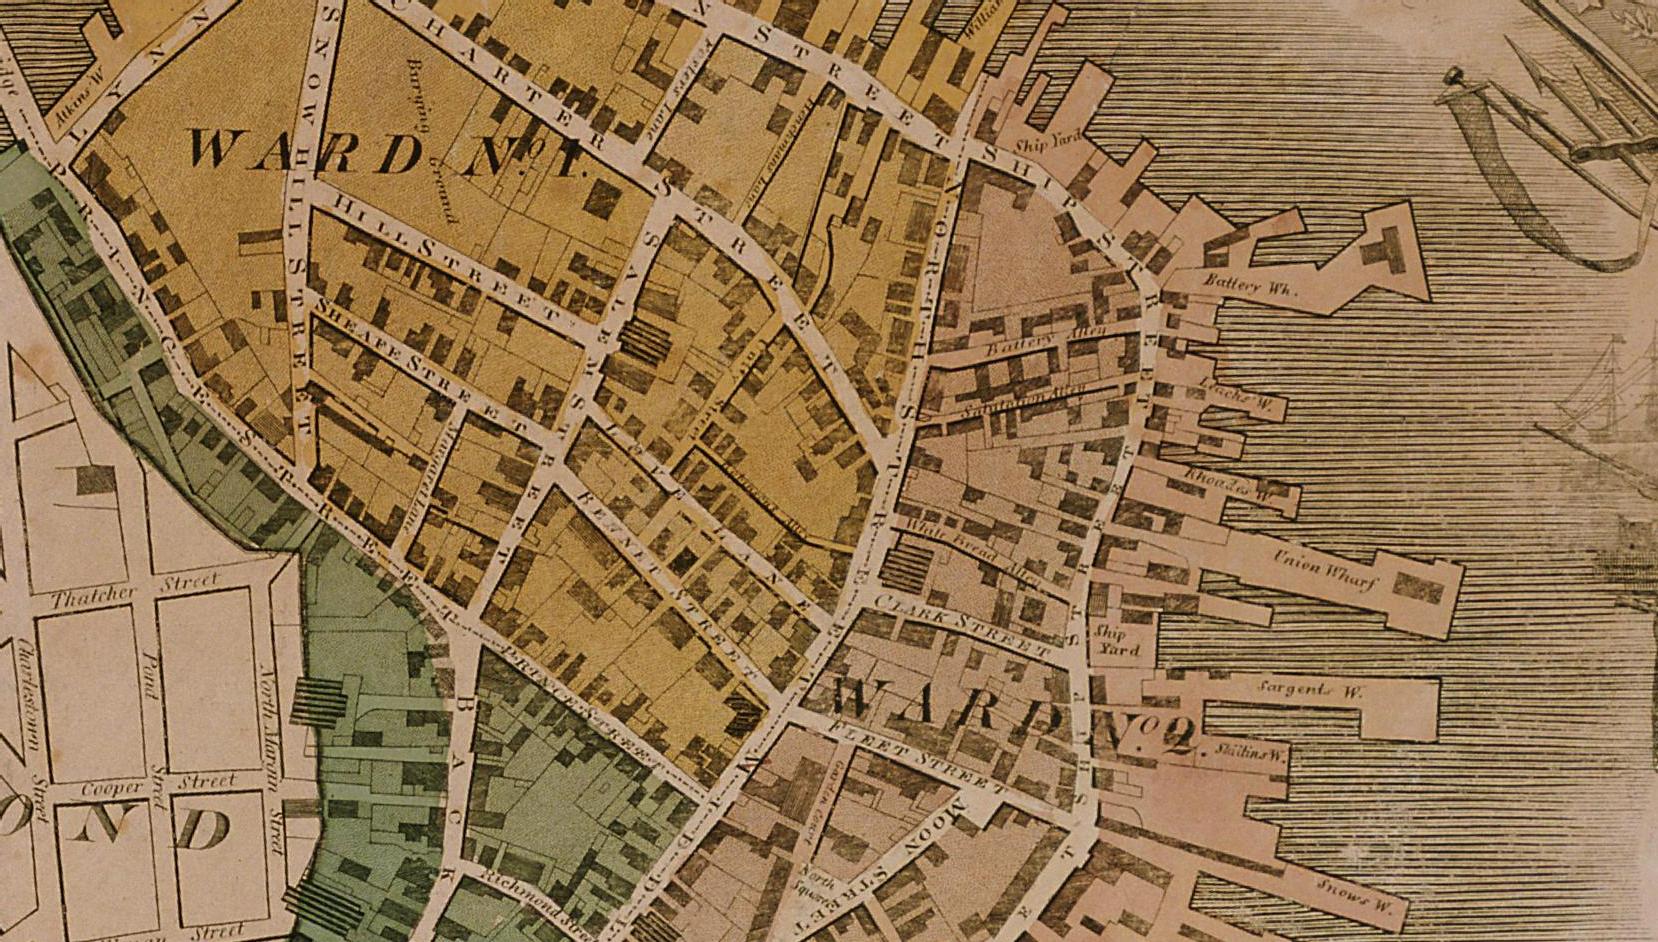
The North End began its journey as a human settlement in 1630, making it the oldest residential community in America [1]. Early maps of the area show sparser residential density in this area than other areas of settled Boston (See Figure [1], 1772) which suggests to me larger plot divisions and in turn wealthier residents. This trend is to a lesser extent still evident in the early 1800s (see Figure [2]); it is interesting that areas of the North End are still less dense than areas settled later. Property ownership is dominated by Englishmen, or at least Anglo-Saxons (see Appendix [1]), especially the estates near my site. It makes sense that the area was to be inhabited by wealthier individuals during the earlier years of area: as a point of first landing and settlement the North End would have naturally presented itself as a capital area.
From this point onwards we see the marked development of what Jackson describes as the walking city. Along with the majority of downtown Boston, the entire streetsides are walled with buildings (though in the North End streets are narrower and the streetside crowding thus more claustrophobic). Thus forms the “degree of intense, inner city congestion” that Jackson states as “the first important characteristic of the walking city.” We see in land use maps (see Figure [3]) that the blocks of my site serve a multitude of different functions: “there were no neighbourhoods exclusively given over to commercial, office, or residential functions... factories were almost non-existent, and production took place in the small shops of artisans.” (Jackson, Ch. 1). These developments of the North End as a kind of the walking micro-city gave it many of the defining characteristics it has to this day, though these features have played different roles in different times.
Little Europe
The late 1800s saw the emergence of many competing European cultures within the North End. Swathes of Irishmen, European Jews, Italians and Portuguese entered the city and took up residence in the area. As such, the names of stateholders turn Sanborn insurance maps into a collection of tiny European cameos in rhythmic units of a census poem. A careful analysis of these maps (beginning from 1885) gives us not only fire safety information but also clues to the traits of each population, indications of their ability to secure footing and grow in the North End reflected in the changes between each map.
In 1885, my site is dominated by single family dwellings (see Figure [3]). This is a relic of the area’s reasonable wealth in the early 1800s as one of the hubs of the walking city; only a few flats and tenements are scattered amongst the blocks. Already Hanover Street is completely lined with stores. Interestingly, Bromley map data shows that single owners often owned multiple adjacent stores; whether this is an early example of false competition as a marketing strategy or simply the multipurpose stocking of these stores I cannot discern from the information presented.
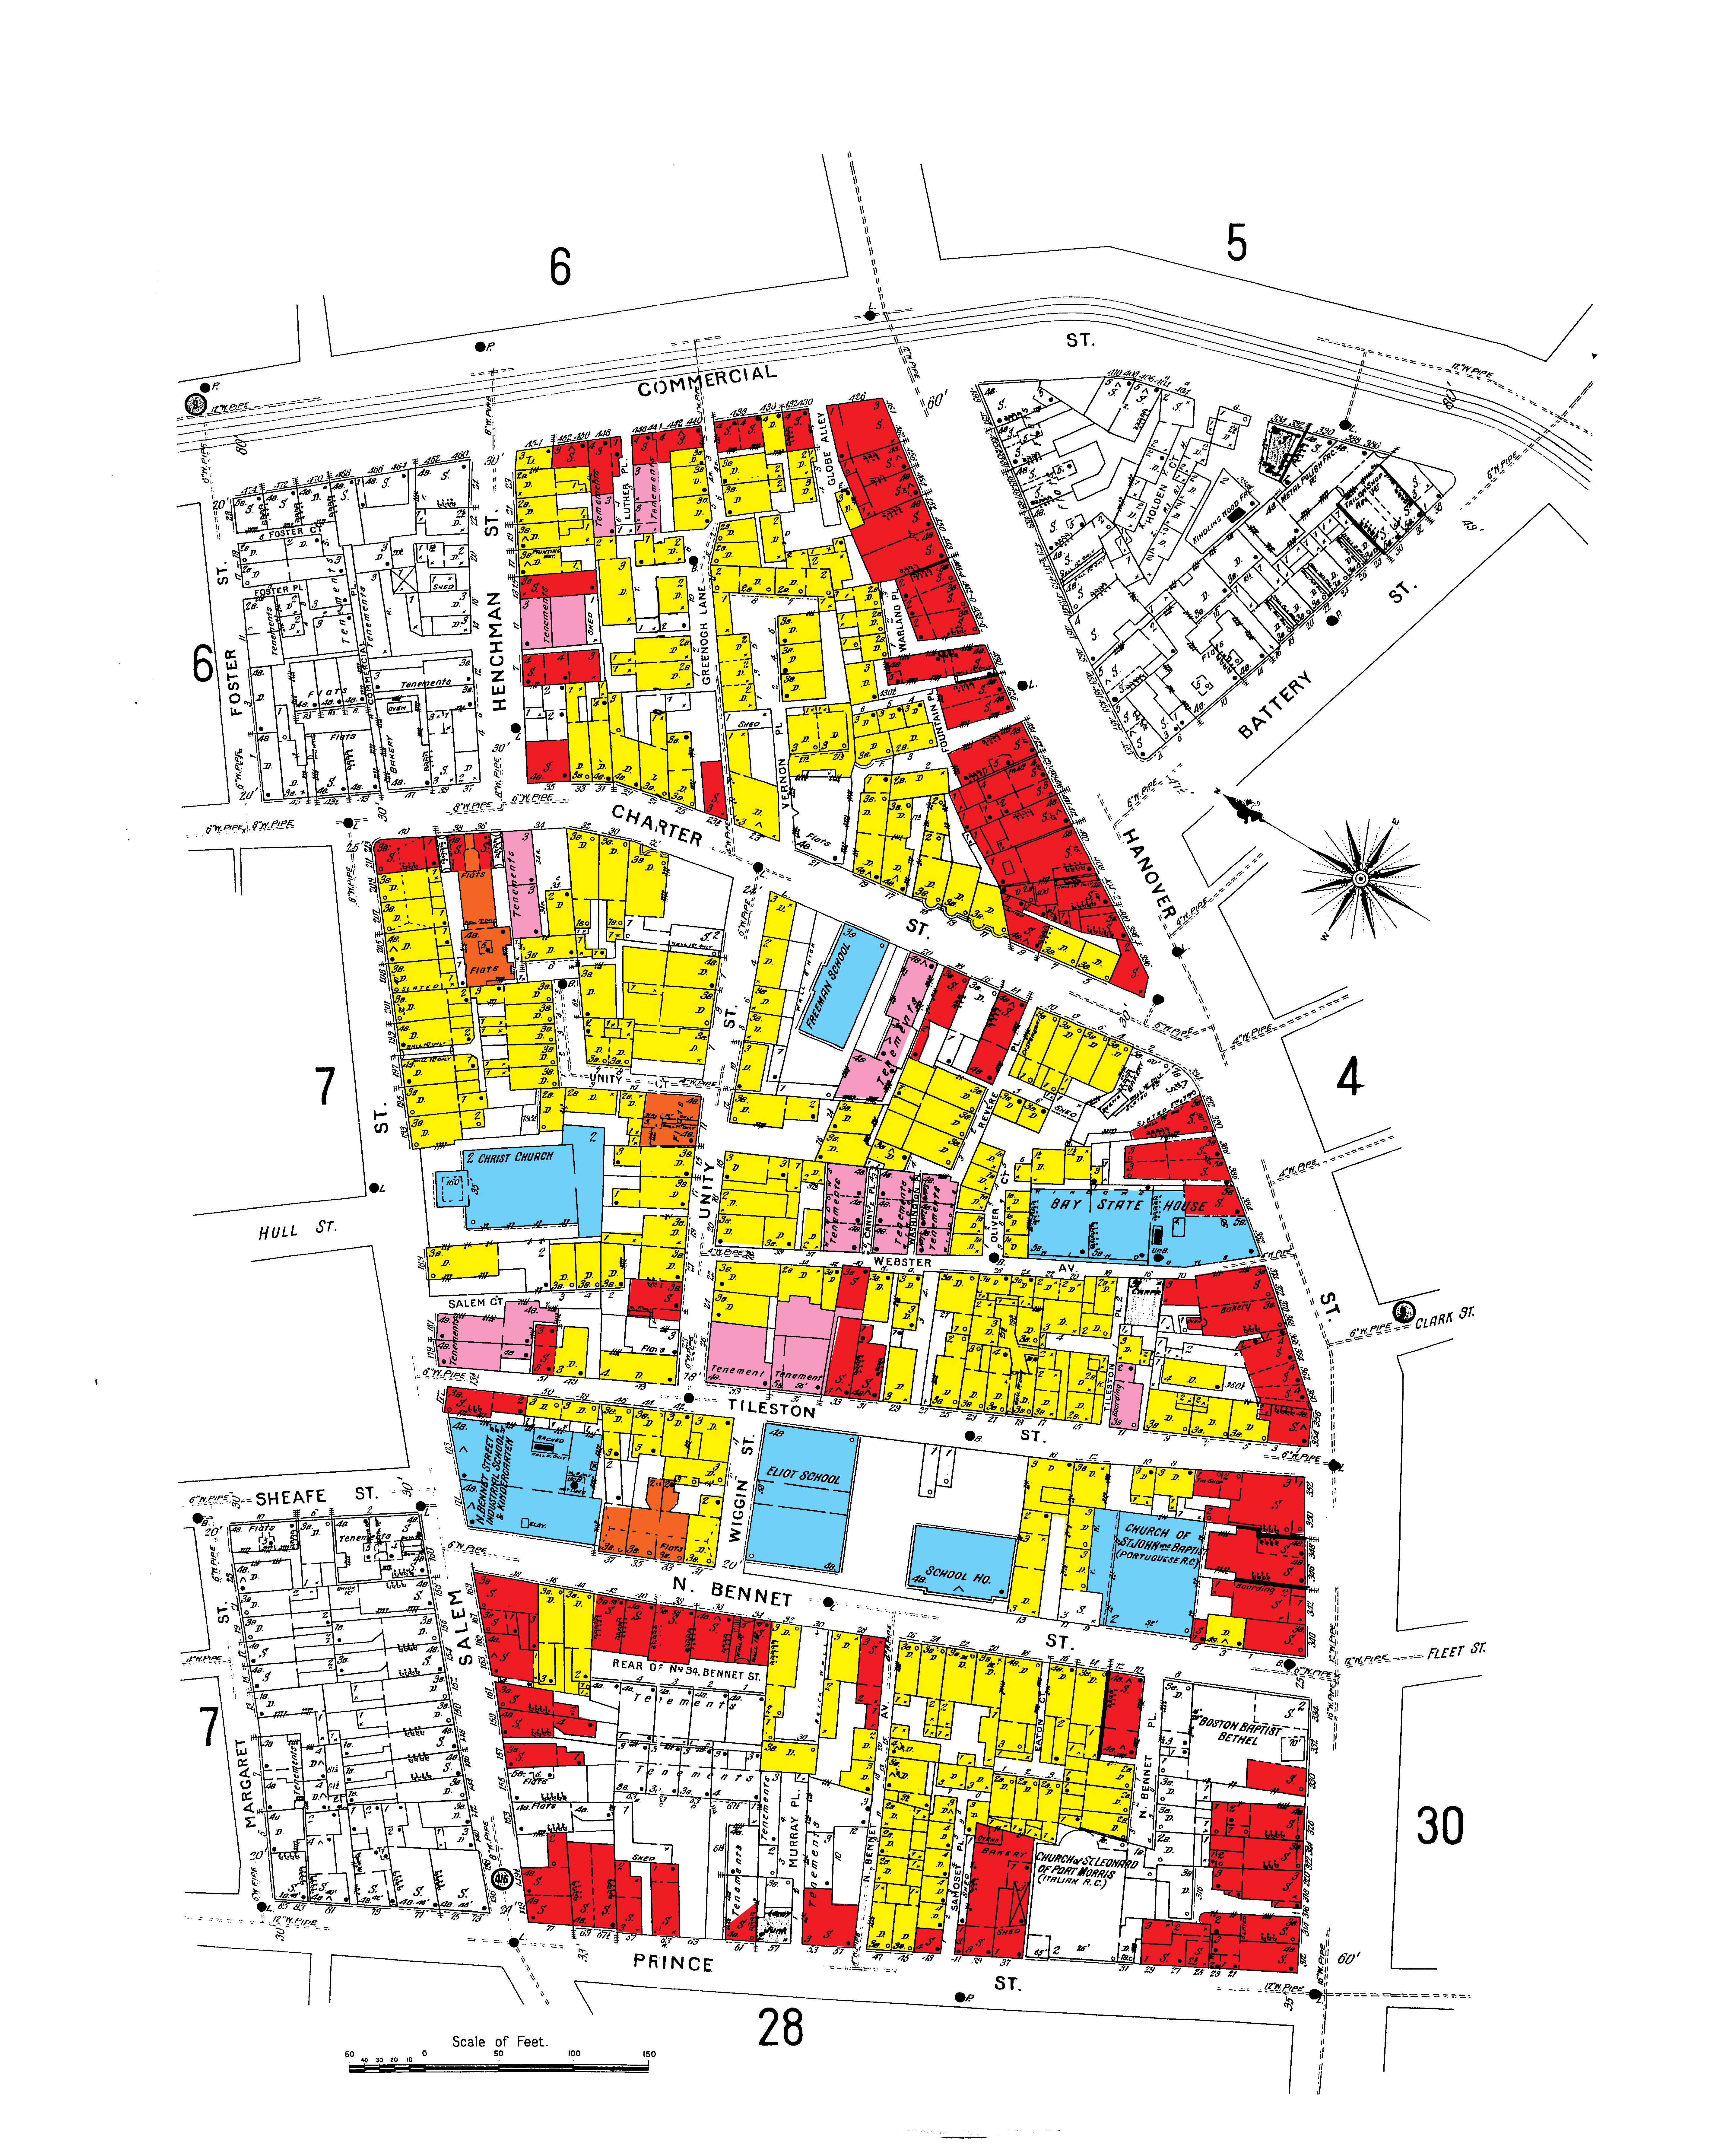
The most prominent demographic in the 1885 map is still Anglo-Saxon, and of these the Irish have a majority. Many of the larger, single dwellings are owned by Anglo-Saxon individuals while the smaller often by Anglo-Celtic; this small difference is a possible indicator of the respectively small discrepancy in wealth (likely due simply to the fact that the Irish had been settled in the area for a substantially shorter time). Furthermore, the large majority of flat or tenement owners are Anglo-Saxon (with the exception of Eliza Hahn and her property on Greenough Lane). I do not have data on the demographics of these multi-housing dwellings, but considering the accepted presence of the other Europeans in the North End, one may speculate that these were occupied by the Italians and Portuguese. Occasionally one notices an Italian property owner; P. Bianoconi appears to be the first Italian to acquire a dwelling for himself. This lack of Italian ownership suggests that the Italian’s had not yet raised enough revenue to substantiate themselves in the North End, possibly exemplified by the fact that they may have entered America as poorer, unskilled immigrants.
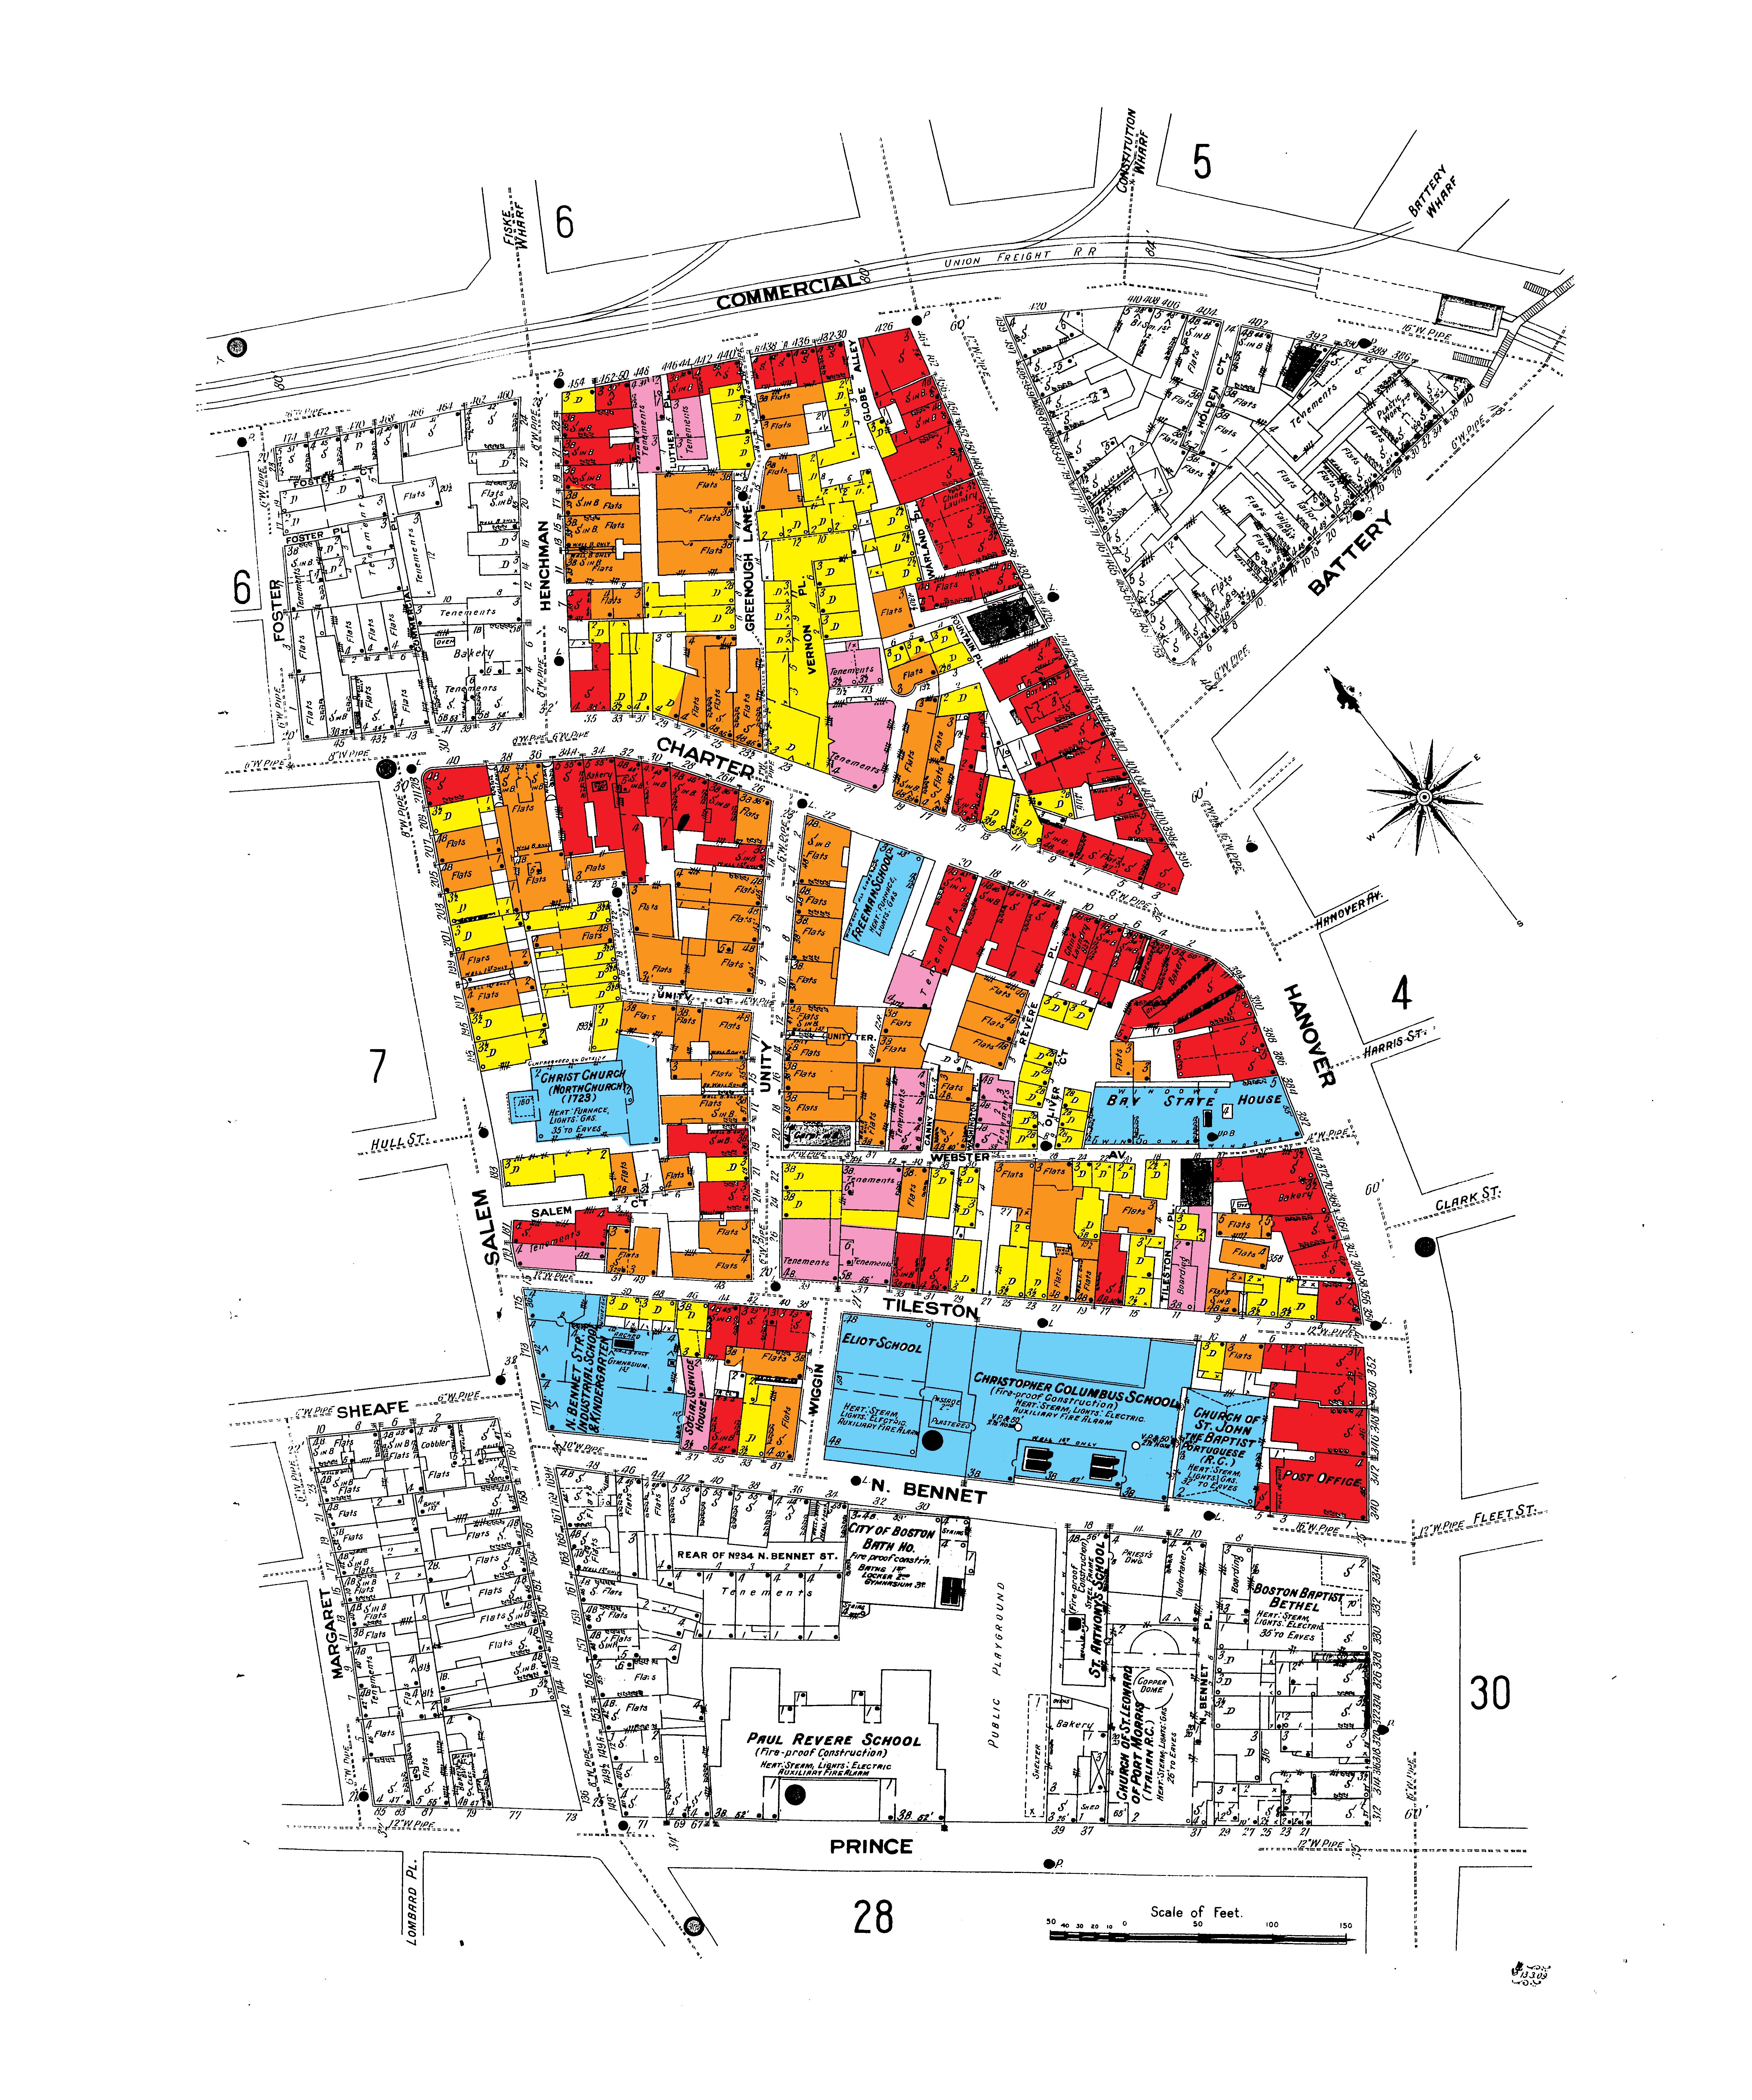
The influx of different European cultures also signaled an influx of different religious practices. Maps from 1775 (Appendix [2]) already show the construction of what is now Old North Church (Christ Church in the maps). This was a Protestant church, but it soon found competition: by 1895 a Portuguese Baptist Church had been erected on the corner of North Bennett and Hanover Streets; across the road lay the Boston Baptist Bethel and behind that the Italian Catholic Church of St Leonard and a Catholic Charity Bureau. These religious institutions in turn took up control of several of the schools on the site: by 1929 the Church of St Leonard was connected to the St Anthony Parochial School, and the Christopher Columbus Catholic High School had replaced the Eliot School, while the Freeman School became public and therefore (assumedly) non-denominational. Unfortunately, it is impossible to tell the religious affiliations of the other schools given our restriction to only maps.
The number of different local religious affiliations (five) and ethinicities likely gave rise to the large number of schools in the area. From 1885 to 1909 there were four schools on my site, and by 1929 this number had grown to five along with the school buildings themselves. This concentration of institutions is not common but assumedly served the community well.
The Turn Away from the Walking City, The Turn of the Century
Maps from the late 1800s and the turn of the century show the effects of the ‘dramatic spatial change… that turned “cities inside out” (Jackson, Ch. 2). As the more affluent moved out to the suburbs, the North End became more densely filled with lower classes and single family households gave way to flats and tenements. Due to the crowded nature of its streets, the site did not have the appropriate layout to support a major new form of transport (the Omnibus and Horse Railway that Jackson talks of as revolutionary in the erosion of the walking city do not make an appearance in this area). However, the development of these modes of transport in other areas still afforded the outsourcing of the wealthy to the suburbs.
What was already a poor area became even more crowded: a comparison of 1885 and 1909 Sanborn maps shows a dramatic tonal shift from yellow to orange as dwellings were refitted to house more people (Figure [4]). This period thus marked the loss of the single family dwelling. The process that had begun with the inflow of people from across the seas continued, as every dead-end court and alcove was filled with wooden structures (evidenced by solid blocks of colour on the later Bromley maps) and more people packed into the space. Furthermore, tenements grew in number, notably built out of wood; the cheaper cost of living translated into a more hazardous existence.
While the North End, like much of the rest of America, felt the hit of the Depression (evidenced by the crowding and increase in tenements), it still showed signs of the course vitality that is so distinctive of immigrants. Despite the worsening financial and spatial conditions, by this time almost all the properties were owned by Italians. The Italians owned both flats and stores throughout the site; noticeably, however, most of the tenements were still owned by Irish or Jewish individuals (noticeably the Bennetts and Bernsteins, who had maintained ownership since at least the 1880s).
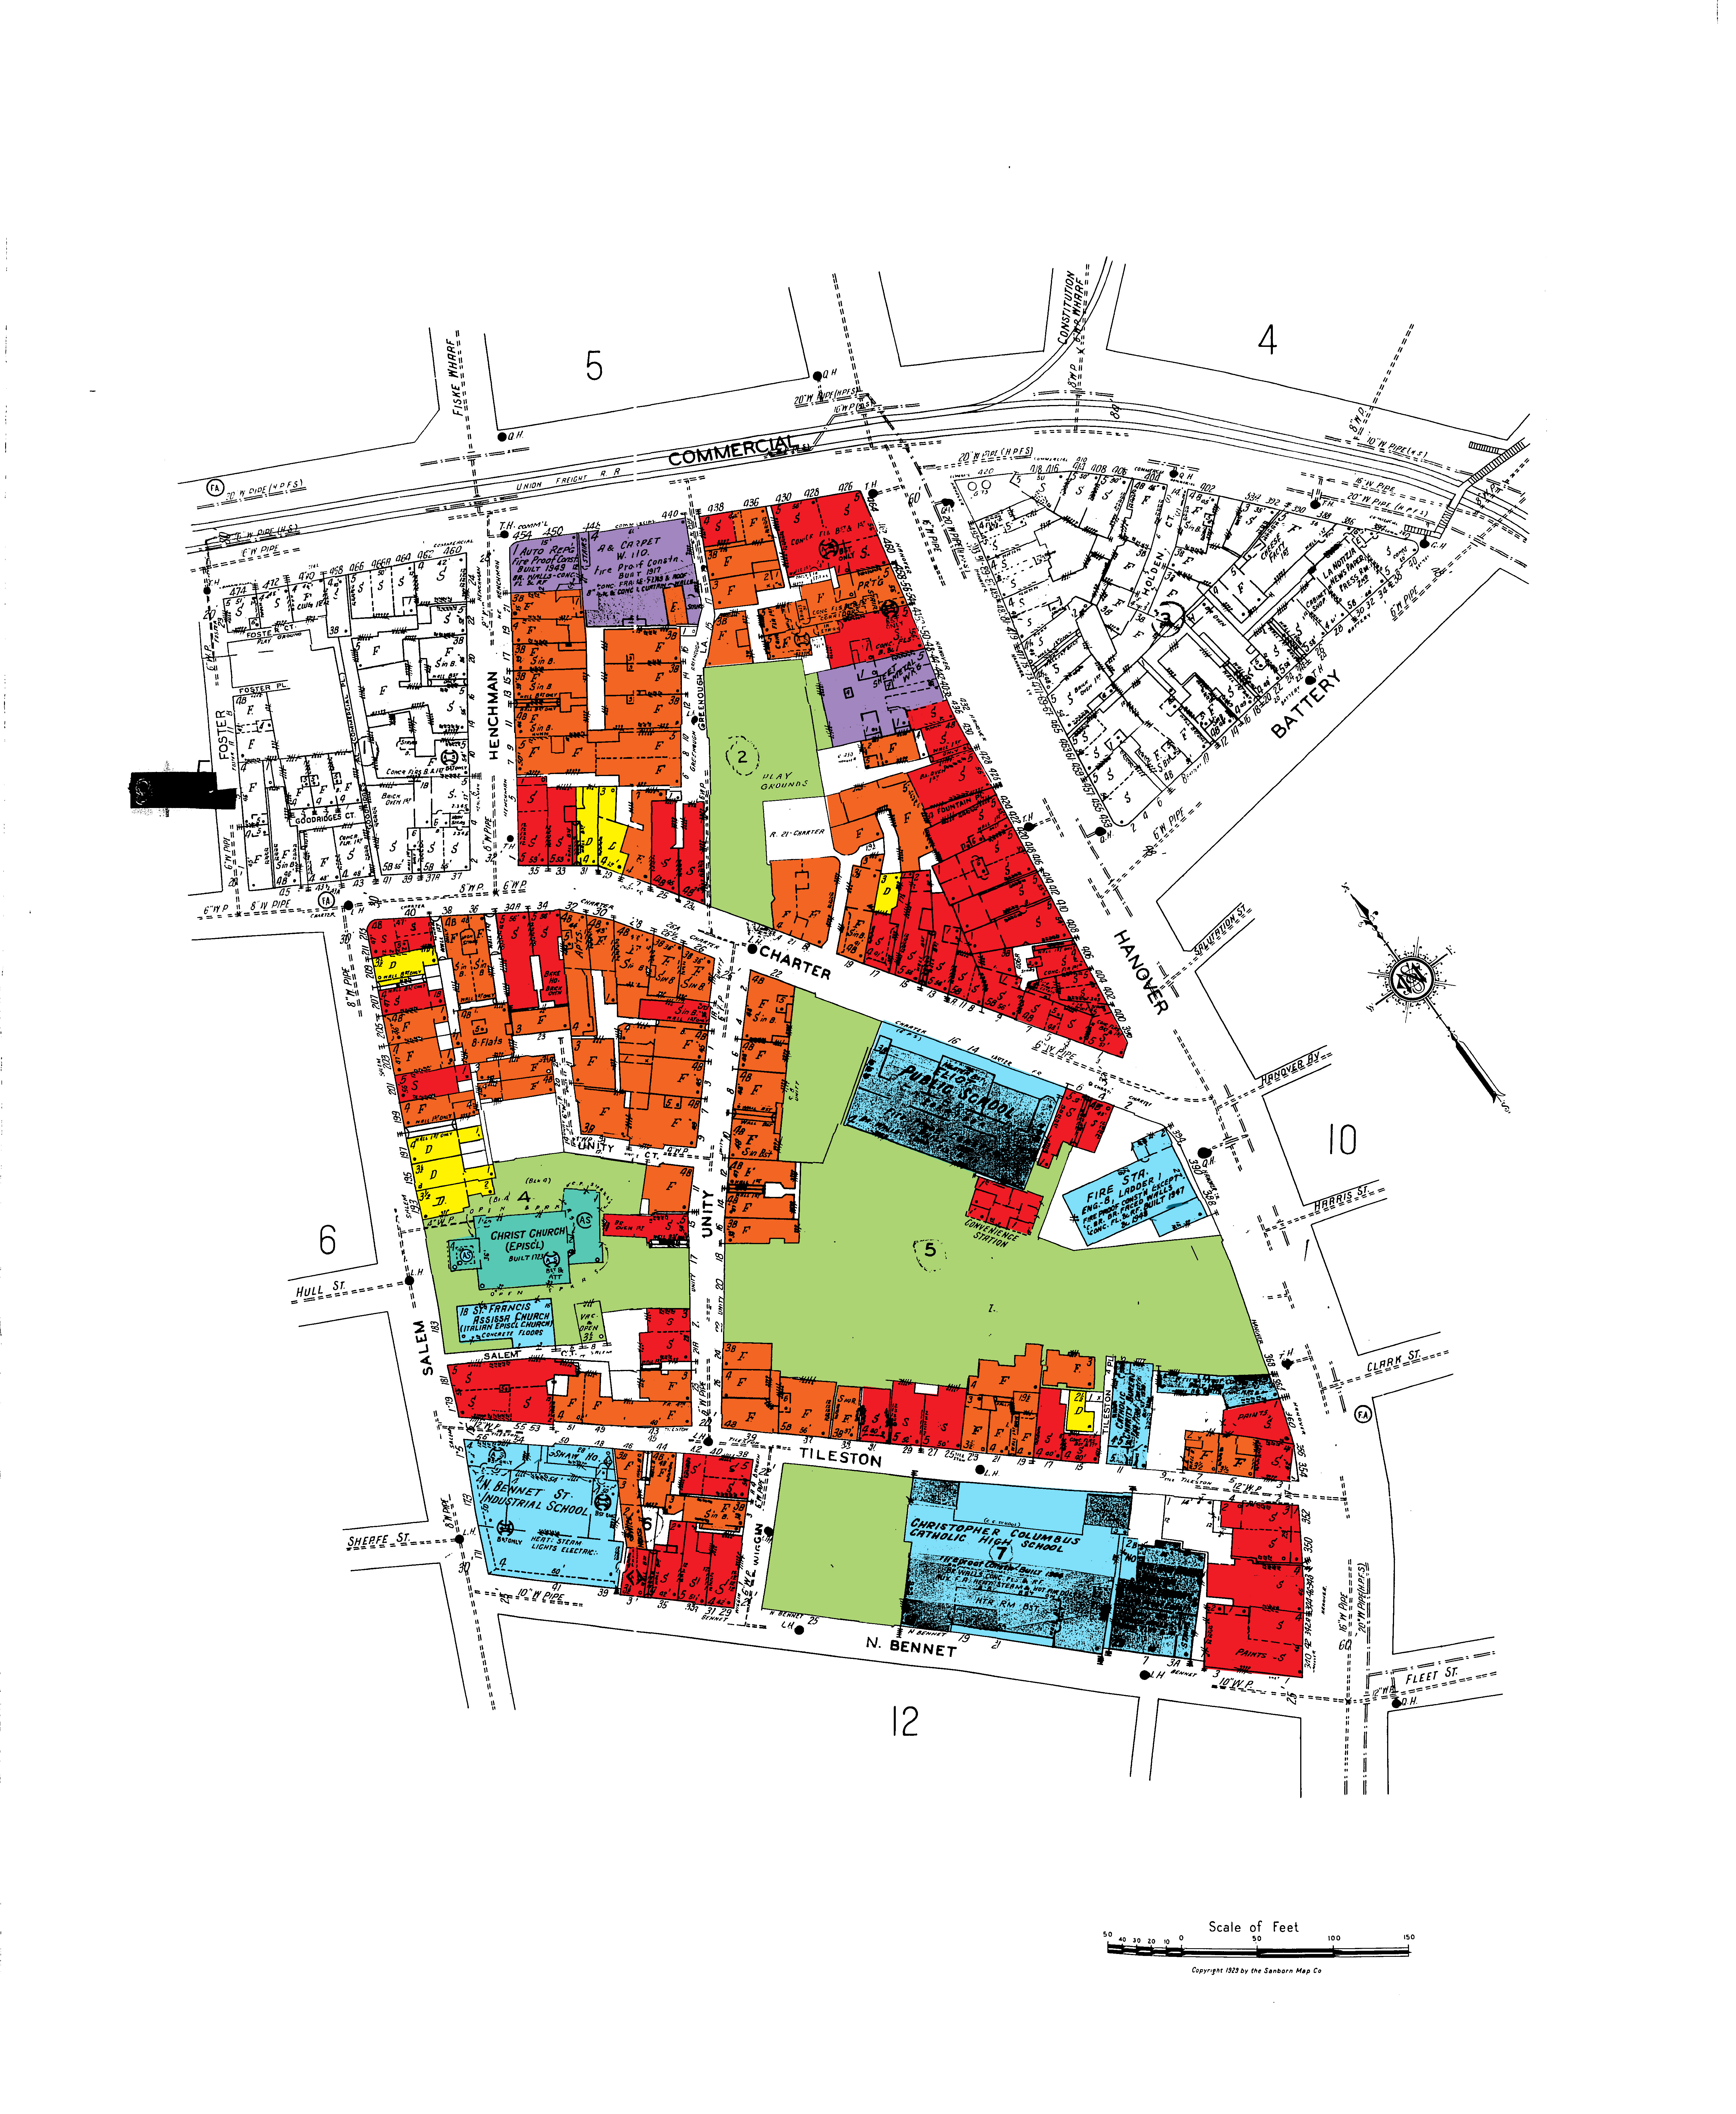
The turn of the century also gave way to several city projects in the area. The North End Playground was built in place of the wooden flats (the area is now known as Paul Revere Mall), a bathhouse and gymnasium were opened on North Bennett Street, along with the Christopher Columbus School and a branch of the Boston Public Library. All these new developments can be seen in the comparison between Bromley maps from 1902 and 1929 (Figure [5]). The introduction of green space suggests the conjoint strengthening of community: public space and facilities serve to create communal interaction. To me this is testament to the intensity of the Italian community and its story in the North End: coming with nothing, they clustered together and developed a livelihood adapted to the monetary and spatial conditions of their site, and, with time, acquired the communal strength to attain material manifestations of their collective stories.
The March Towards Modernity Brings The North End Back
Land use maps from 1962 and 1974 (Figures [6]) show very little difference from their counterparts made in the 1920s. The only noticeable difference is the reemergence of the single family dwelling, the increase in number of stories of buildings and the addition of a parking lot. Even these do not denote anything remotely close to a major change in land use. The lack of major change is perhaps another testament to the resilience of the inhabitants of the North End: having struggled so hard to adapt to the site, North Enders perhaps refused to let what happened to the West End happen to them.
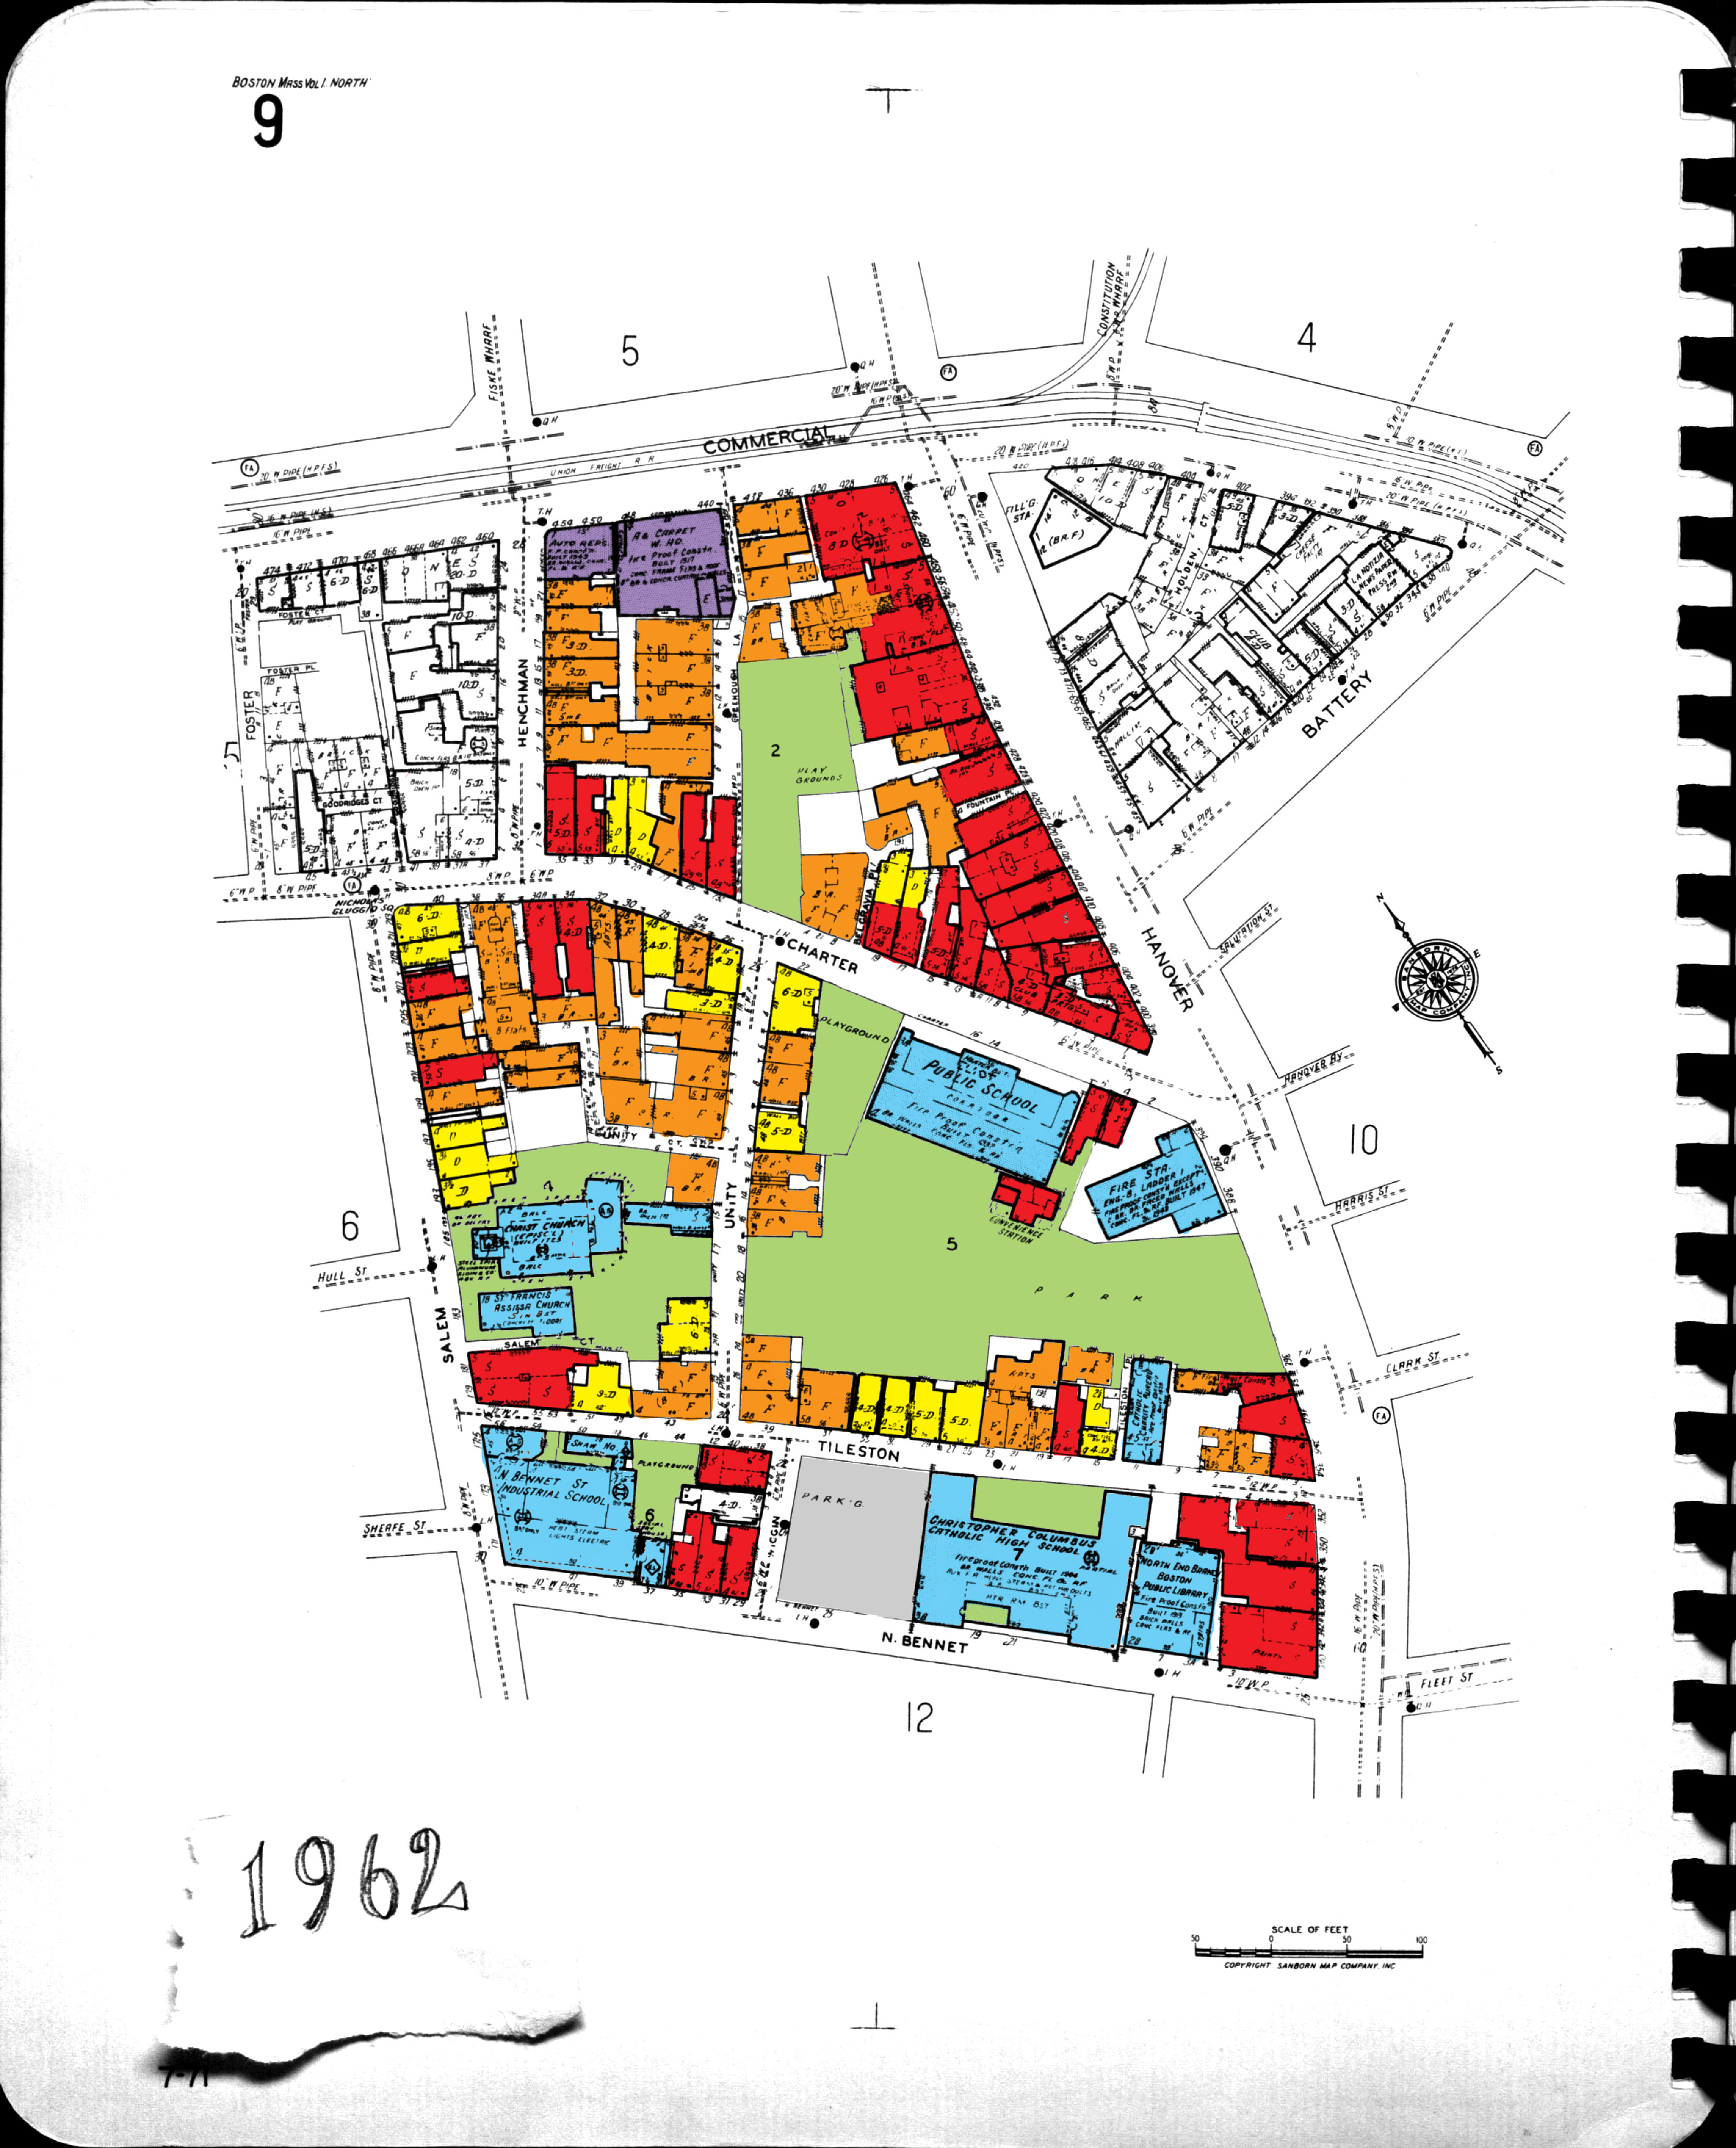
The North End has thus largely (completely?) ignored the period of urban renewal and housing demand. Many other sites of similar location and traffic underwent consolidation and expansion under the mindset of “bigger is better” (Jackson); residential areas, under the strain of post-war housing demand, financed developments and subdivisions (Jackson, Ch. 13). The North End instead maintained its infrastructure; buildings kept their foundations and even decreased in density. The parking garage did not make an appearance; only its little brother the lot has established a place on the site. In a way, the North End found its way back to its place as a walking micro-city, though perhaps more as a walking suburb. It still displays some of Jackson’s most important characteristics of the walking city: it remains crowded, furthered by the ability to build higher residential blocks, and retains the “mixture of functions” it had years ago, with “public buildings… churches… shops and homes … interspersed, or … located in the same structure.”
As such, we see that there has been little change in the land use of the North End; rather, the change has been in who uses the land. Wealthy colonial beginnings gave way to the crowds of poorer European immigrants, the main ethnicity of these changing in itself. The North End that became the immigrant slum once again redefined itself and stabilized into the tight(ly packed) community of Italians that supposedly represent it today. Obviously my observations are informed only by maps interspersed by at least five years, my understandings of economic situations mainly informed by socio-political events and the density of residential areas; thus, my conclusions must be checked with other secondary sources. That said, using maps as the sole source of information has been incredibly insightful. The analysis of maps is not so much an analysis of cartographic accuracy as a reading of human narratives. Early maps of topographical features showed the location of the North End as one of the few rocks the British settled upon; maps of the past century show my site over the years as one of the only rocks that has stood strong through time against the catalytic forces of urban change in the twentieth century.

Bibliography:
Jackson, Kenneth T. Crabgrass Frontier: The Suburbanization of the United States. New York: Oxford UP, 1985. Print. Krieger, Alex, David A. Cobb, Amy Turner, and Sam B. Warner, Jr. Mapping Boston. Cambridge, MA: MIT, 1999. Print. Page, Thomas H. "A Plan of the Town of Boston and Its Environs." Map. N.p.: n.p., 1776. N. pag. Library of Congress. Library of Congress. Web. 5 Apr. 2013.
Appendix:
Appendix 1
 Appendix 1: Historical Map of the North and Central Parts of Old Boston with explanatory key compiled by James Webster Robinson, 1810. This map is numerically labelled with references to a table on the left; there is evidence of Anglo ownership in the North End.
Appendix 2
 Appendix 2:1775 Town of Boston -Faden (Library of Congress); it is perhaps difficult to see, but Old North Church already exists on this 1775 map.
Appendix 3
 Appendix 3: 1814 Boston Hales Map (Boston Public Library); Here we see the spacing of the properties; houses are well spaced and seem to have large yards (could this possibly be some kind of precursor to Jackson's talk of the dream suburban yard?). This relatively generous is wildly different from what is to appear within the next half century.