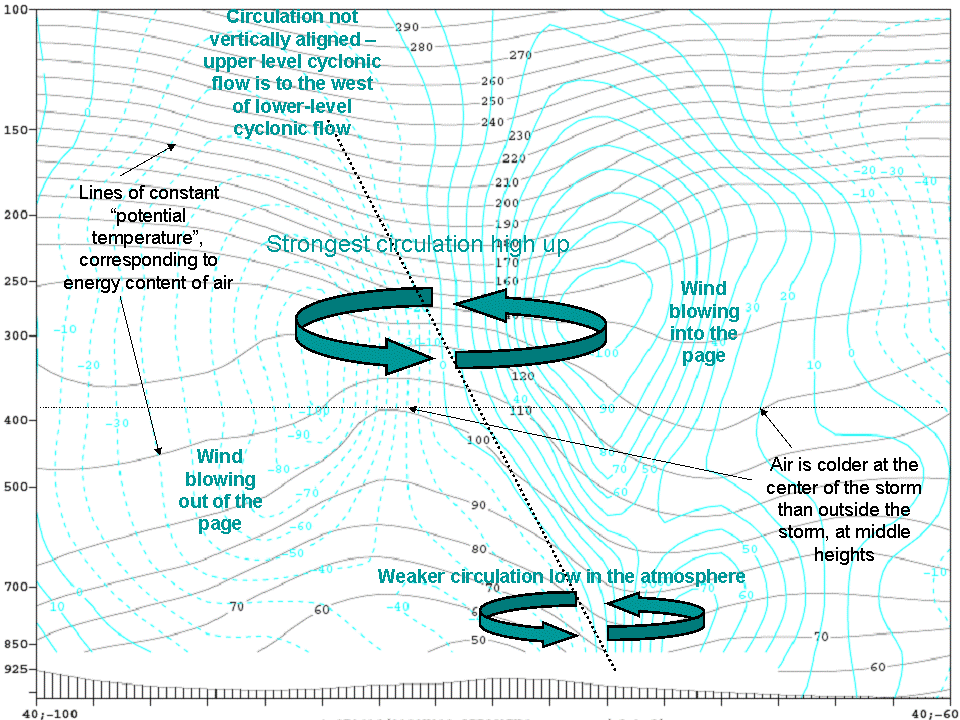
Cross-Sections of an Extra-Tropical Cyclone
It's interesting to look at cross-sections as well as maps of extra-tropical cyclones, because they show a lot of the important structure of the storm. Below is an east-west cross-sectional diagram of the 2007 Nor'easter when it was near its peak strength. The strong circulation, especially at high levels, and the tilt of the storm, can both be seen. The vertical axis on the figure is pressure, and sea-level pressure is about 1000 in the units shown. Pressure decreases by about a factor of 2 for every 3.5 miles you go up in the atmosphere shown here, so the top of the figure is about 14 miles high. Wind speeds are shown in miles per hour, and potential temperatures are shown in degrees F. The temperature structure of the atmosphere is fairly complex and wavy -- not generally flat outside the storm the way the atmosphere in the tropics was.

Another east-west cross section of the storm is shown below. This time we are looking at how fast the storm is spinning in different parts, as compared to the background spin rate of the earth. The peak spin rate of the storm isn't as high as it was for the tropical cyclone, and instead of a maximum at the surface that slowly decays as you go up or away from the center of the storm, there are two maximal regions of spin -- on near the surface, and one higher up in the atmosphere. There is also a strong tilt between these two zones -- they are some 400 miles apart horizontally. This is, again, much different from the case of the tropical cyclone, where the circulation is so well aligned in the vertical that you can see straight down through the eye of a storm.

