|
Glacial Icebergs: Sources of FreshwaterA Proposal and a Plan With Accompanying Statistics With the dwindling supply of water in an ever-growing world becoming an emerging problem in the 21st century, new methods of water harvesting must be developed. In this research proposal, we outline a well known source of potential: glacial water. We have created estimates of the cost of transporting water through a land pipeline from Alaska to the western United States. We have also analyzed a possible long term solution involving not only Alaska, but also Antarctica, which contains approximately 70% of the world's freshwater. Outline of Proposal: I. Alaskan Glaciers, their potential, and the cost-effectiveness of such a venture. IIa. Iceberg Identification IIb. Possible Iceberg Transport Techniques III. Discussion
Reasoning: Alaska is part of the United States. Harvesting icebergs that are lost due to calving will mitigate the loss of freshwater due to climate change.
Basic Info + Statistics -GRACE (US and German satellites) report a loss of ~211 billion tonnes of ice lost per year around the globe, which equals to 2.11*10^14 kg= 1.94*10^14 kg of water. (Nature News, 2008) -100,000+ Glaciers in Alaska (US Forest Service). -Glaciers cover 75,000 km ^2 of Alaska. (Molnia, 2008) -Tidewater glaciers lose freshwater ice through calving (the ice breaks into icebergs which float into the ocean). -Mass-balance estimations are currently being investigated with satellites. -Total freshwater use in the US: 387,000,000 acre-feet per year (2000 statistic). Click here for external table of yearly water use.
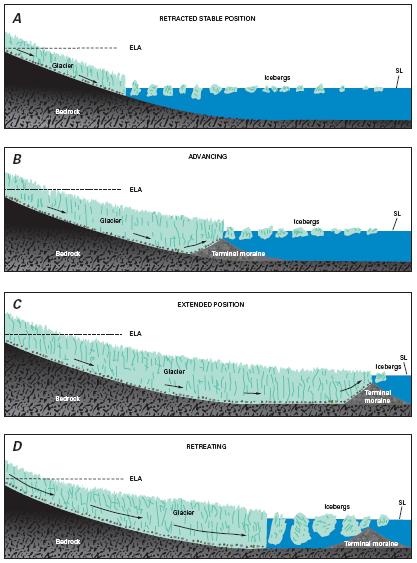
Tidewater Icebergs and the processes by which they break away. (Molnia, 2008)
Suggested Glaciers (2004 status) The glaciers of most interest to this project are the large tidewater glaciers. These are glaciers that melt into the sea as icebergs calve off of them during periods of advance or general warming of the seawater. To be a long-term source of water we need large glacial systems. The following selection of glaciers fit these parameters, and are all located in Alaska. Malaspina Glacier /Seward Glacier System Area: 5,008 km^2 Status: Rapidly Retreating Hubbard Glacier Area: 3,685 km^2 Status: Stable (slow advance in 1999) Bering Glacier Area: 5,173 km^2 Status: Stable (drastic retreat in 1999) Guyot-Yahtse Glacier Area: 1,432 km^2 Status: Retreating Statistics from (Molnia, 2008) Select Tidewater Glaciers: Model Example Total loss of water in the Malaspina and Seward Glacier systems from ~1970-1995: 63 km^3 +/- 13 km → ~51,074,931.2 acre-feet (Molnia, 2008) This figure equals 1.66428393 × 10^13 US gallons and is approximately what the entire US consumes in < 48 days (today) using the computation: (51,074,931.2 acre-feet/387,000,000 acre-feet)*365 In 48 days (1.6 months), according to the formula used to calculate the cost per year in the residential sector, the cost of water for the entire US is: ($1,692,277,980) 1/month * 1.6 month→ $2,707,644,768
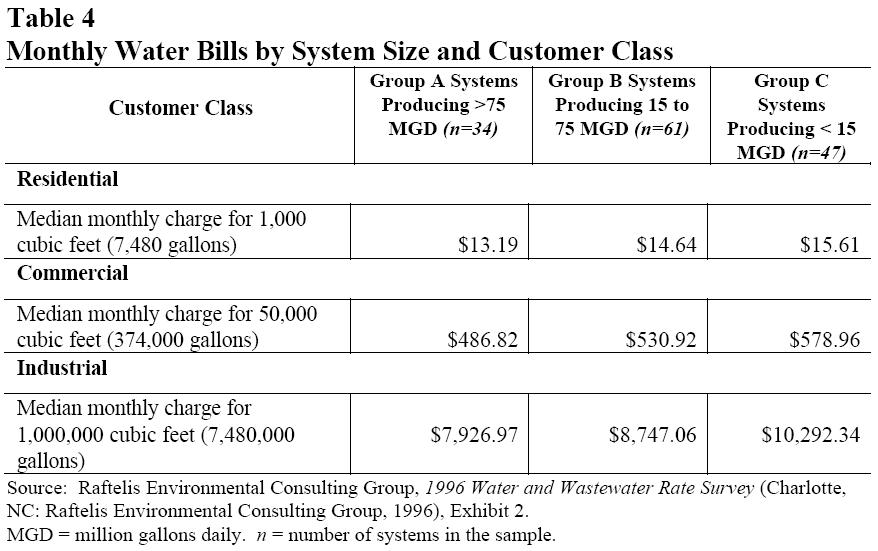
Water Costs as of 1999 According to EPA
Cost Prediction (Residential Only) -According to the US Census Bureau (2005), the population of the US is expected to be ~363,584,435 in 2030. -According to the US Census Bureau (2000), the average household size = 2.59 -There are ~115,830,115 households (with a population of ~300 million) in the US currently. 1. Taking the weighted average of the residential charges allows for the calculation of how much the average household pays per month for water. 
2. Multiply the # households by $14.61 → the US residential sector pays ~$1,692,277,980 for water per month → ~$ 20.3 billion for water per year. This number should be even higher due to the increase in cost of water (over the last 5 years, US water prices have increased an average of 27% according to the Earth Policy Institute.
Distance of Transporting Water:
Transporting water to from Alaska to the lower 48 states, requires that a pipeline will serve as the major means of transportation.. It is crucial for the pipeline to cut through western North America and to be terminate where it can be stored underground. Aquifer storgae will be necessary because the rate of iceberg melt and demand are unpredictable, varies from glacier to glacier. 2 Possible Routes, depicted using Google Earth: 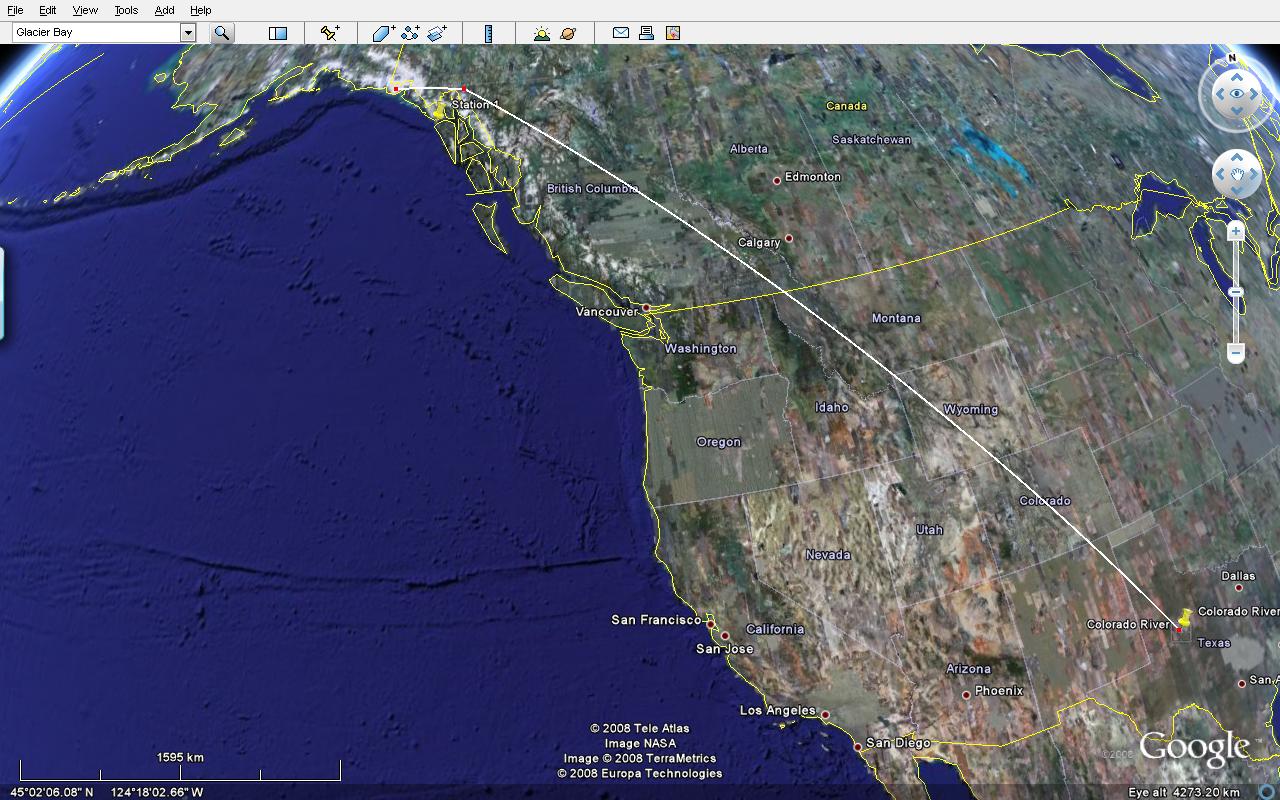
Straight land distance from Yakutat, Alaska to the Colorado River, TX (passing locations of interest) → ~2,630.89 miles

Straight water distance from Yakutat, Alaska to Los Angeles, CA → ~2204.72 miles (no cost estimate available)
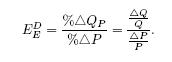
Intrinsic Cost of Transporting Water on Land Water transportation via different systems are common today. There are different types of canals and pipelines which are utilized today to transport water to many arid locations. The Middle East is one case in which there is a long history of water transportation. According to Zhou and Tol (2005), transportation of water costs are as follows: -Study Parameters: For 100 million cubic meters → 81,071.3194 acre-feet 6.1 cents / m^3 per 100 km → ~ $25,884,563 for 81,071.3194 acre-feet -Mode of transportation: canals Zhou and Tol studied numerous systems through literature searches, and their estimates are specifically for the transportation of Egyptian water into the Middle East. However, given that their study is the most readily available source of transportation found (many commercial sources are reluctant to divulge such potentially sensitive information), we can apply similar values to the water in the West. In our study: Modified Parameters (2630 miles): Zhou and Tol gives a rough relationship between increasing the flow and the unit price of water: 1% increase in total water flow equals -0.08% unit cost of water. By applying a Price Elasticity Formula (MIT OpenCourseWare: Professor Chia-Hui Chen, Course 14.01 Fall 2007 ): The cost of transporting 51,074,931.2 acre-feet of water (lost from Malaspina Glacier) = ~ $169 billion per year, with the unit price (per m^3) = $2.96 via canals. If pipelines are installed, the total cost would increase by 271% → entire cost of project = $169 billion * 2.71 = $457.99 billion The entire cost of the transportation of water should be even higher than this value given that there is vertical lift involved in the pipeline when it is passing through the Alaskan mountain ranges. Moreover, there are factors such as the presence of unstable terrain (i.e. rocky soil, sand) which would increase the price to transport the water. Zhou and Tol predicts from the literature that the increase in cost will be 13% and 175%, respectively. Cost of Transporting Water on Land (Not Including intrinsic cost of transportation) Besides the cost of transporting water, a pipeline must be build to facilitate the transport of water. The following are examples of how much a theoretical pipeline costs, and offers a rough range of figures. Pipeline Estimates from Various Sources: Low to High Estimates 1. Mesa Water Inc, which transports water in Texas, estimates that the cost of a pipeline per mile in the Southwest is ~ $1.5 million / mile (http://www.mesawater.com/FAQs/default.asp). Interpolating this, we get $3.946 billion for the cost of a 2630.89 mile pipeline (without taking into consideration serious parameters such as terrain). 2. According to a 1988 article in the New York Times , a proposed 4,800 mile pipeline between Alaska and the 48 states cost $14.6 billion. By adjusting for inflation using an inflation calculator tool, and using a linear model for such costs, a 2630.89 mile pipeline would cost $14.8 billion today. 3. If the Zhou and Tol model is taken into account the entire cost of project = $169 billion * 2.71 = $457.99 billion Cost-Effectiveness Shipping water from melting glaciers via pipelines is not cost-effective at the present time). However there are two main variables which must be taken into consideration in determining the future cost-effectivnesses of this venture: The demand for freshwater, and the amount of water that can be produced. In addition, building the pipeline before shortages lead to crisis will ultimately be cost-effective. 1. In order to compete with wastewater pricing ~0.669 euro ($0.83--the current cost of treating 1 cubic meter of wastewater) (Hernandez-Sancho and Sala-Garrido, 2008), the transport cost per cubic meter of water must be less. This can be achieved by increased demand for freshwater, since demand and price have a positive correlation. 2. In order to decrease the unit cost of ~ $2.96 down to $0.83, much more water must be collected (with the elasticity function). The amount of water required to compete is ~2.145*10^10 acre-feet (around 420 times the water of the Malaspina Glacier). This can be achieved by having a larger water source, since a greater amount of water transported means that the cost of each cubic meter of water transported decreases. Can pipeline transport ever be more cost-effective than wastewater treatment? Yes!, But only for enormous amounts of water. A typical elasticity function has a constant slope, so at some point it will pass the effluent cost curve.

A figure from Hernandez-Sancho and Sala-Garrido, 2008. on the price of effluent treatment.
Select Cities and Water Transport (Zhou and Tol, 2005) 
Table 4 (Zhou and Tol, 2005) shows the cost for transporting water. At first glance these values seem to be competitive with current wastewater treatment methods, but the distances traveled is much less than the hypothetical pipeline between Alaska and the Colorado River.
Beyond Alaska
Beyond Alaska The current situation relates the lack of feasibility for creating a pipeline to transport meltwater from Alaskan glaciers. Current pipeline cost-predictions vary, and according to Zhou and Tol, very little literature has been published in that field. If the costs of building a pipeline and the costs of transporting the water are to be ignored, there is still the fact that the water has to transported from Alaska to the American West. This requires the pipeline to traverse past Canada, and thus has political implications as well. However, it is of interest to note that the water being transferred starts from American soil and ends on American soil, which does alleviate some of the bureaucracies of NAFTA water agreements. If a large scale project were to be undertaken in collecting calving icebergs, more suitable locations may be in Greenland and in Antarctica. Another significant hurdle that must be addressed is the conversion of glacial ice into meltwater. This can be done by collecting calving icebergs, shaving the ice into smaller sheets which are melted through a processing plant and finally purified through a centrifuge. Current treatment companies such as Siemens Water Technologies manufacture these centrifuges. This adds to the total cost of the project, and is similar to wastewater treatment techniques.
Iceberg Utilization may be applied not only to Alaska, but also to Antarctica and Greenland. For the purpose of this study, methods of shipping icebergs from Antarctica to the West Coast was analyzed. Reasoning: For a truly long-term solution, progress must be made to develop techniques of harvesting the world's largest freshwater source: Antarctica. Iceberg Utilization Part A Tracking and Selection of Icebergs Several methods can be utilized to locate and identify icebergs (Swithinbank, 1978). A prominent method of identification is pulsed radar, which operates in the frequency range 30-300 megahertz.. Pulsed radar mounted in a series of aircraft has been used to measure the thickness of Antarctic tabular icebergs and the ice shelves from which they originated. Echoes are then displayed with oscilloscopes and are continuously recorded on 35 mm film. Measured iceberg thicknesses have proven to range from 30 to 280 meters. Other qualities of icebergs are usually analyzed as well, such as dielectric absorption. This will indicate the bottom roughness or the presence of ice frozen from seawater. This water must be subtracted from the usable mass. A representative sample of results that British Antarctic Survey Aircraft have gathered tracking a distance of 80,000 km have shown that measured iceberg thicknesses have ranged from 30 meters to 280 meters, while measured thicknesses of floating ice shelves range from 30 to 1,816 meters. The error of measurement is +/- 10 meters. Antarctic tabular icebergs are not nearly as homogeneous as they appear. If icebergs are to be used for water supply, it will be important to select as perfect specimens as possible. We can identify crevices, surface melt lakes, changes in thickness and density due to the confluence of ice streams. All of these affect the structural integrity of an iceberg and the likelihood of it breaking up during transportation. Some icebergs which are structurally unsound include dome-shaped icebergs, whose shapes indicate erosion at the edges. This may lead to hydrostatic disequilibrium and the creation of stresses which can break up the iceberg. Other icebergs can have underwater spurs that extend over 200 meters, thus creating significant drag and posing dangers to underwater sea vessels. In summary, although Antarctic icebergs have been reputed as being flat homogeneous slabs of ice this is not always the case and therefore proper selection is necessary. The mor! e smooth the shape of the berg the more easy it is to handle with and therefore the more usable it is. Microwave Radiometers (MICRAD) for Iceberg Identification The rapid advance in millimeter wave technology has made it possible to develop passive microwave and millimeter wave radiometric devices capable of producing high quality imagery from airborne platforms (Moore, 1978). MICRAD sensors allow rapid airborne survey of areas despite the presence of diverse weather conditions that exist for a large portion of the time at the location of interest. The radiometric signal also contains information about both the composition and physical structures of icebergs. This is extremely important because both the structure and the composition will determine the degree to which the iceberg can be transported and also the means used in this procedure.The resolution achievable with MICRAD images allows not only the detection of icebergs, but also measurements of dimensions as well. MICRAD imagers are fairly cheap and simple devices, making them preferred and easily installed. A MICRAD sensor is essentially a very sensitive receiver which detects emitted and reflected radio frequency radiation from terrain. The operation of infrared and MICRAD systems is similar since both detect natural black body radiation. However, at IR frequencies power is proportional to the forth power of the temperature and the signals received are dependent on the actual temperature of the objects being observed. At millimeter wave and micrometer wave frequencies, power is approximately proportional to the first power of the temperature. Also the variations in emissivities and reflectivities at these frequencies are large compared to the variations in thermometric temperatures. Thus MICRAD contrasts do not exhibit significant diurnal changes nor are they significantly affected by the thermometric temperatures of the objects being observed. Therefore radiometric contrasts at these frequencies tend to be more stable measurements of material composition an!
d structural characteristics than IR measurements, which may be strongly affected by the thermal environment. This fact makes the method more beneficial.
Small-scale modeling of iceberg transport- Small-scale models can provide practical predictions for full-scale designs. Determination of power requirements, consideration of fragmentation and melting, and the possibility of hydrodynamic instability that may cause the iceberg to tip during the transportation are complex unknowns with relatively little available data for the evaluation of their importance in designing the model. Three main factors need to be considered in the small-scale model. A loss of mass- The outer surface of the ice absorbs heat, tending to expand but will be restrained by the inner colder mass. The stresses that will develop may lead to spalling. This will reduce the quantity of ice that will arrive safely at its destination and cause a hazard to navigation as well. Let us remember that although navigation mechanisms are highly advanced such that ships can easily detect and avoid iceberg fields, icebergs will always be a hazard for vessel integrity. Floating stability- The rate of melting above water and under water will be different because of the temperature gradient that exists between top and bottom of the floating mass and because of the influence of circulating water in removing heat at a different rate from circulating air. This will result in a shift in the mass metacenter potentially causing the berg to tip. Navigational Considerations- Considerable skill is required to navigate a 300,000 tonne tanker. The momentum of a 300,000,000 tonne mass of ice is a thousand times larger at the same velocity. One can imagine the magnitude of the forces that will be required to steer or control the mass of ice especially where the currents tend to deviate the berg from its designated path. The magnitude of these forces needs to be adequately modeled.
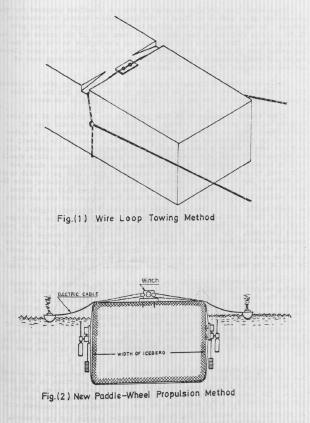
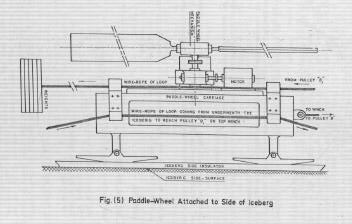
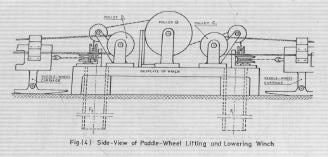
The following procedure and equations are referenced from (Murphy, Glenn 1978). These equations determine numerous variables which affect the transport of model icebergs: The variables that need to be introduced in this model are: force, control length, other dimensions, velocity, ice density, fluid density, fluid viscosity, acceleration of gravity, mass loss, specific heat, thermal conductivity, heat of fusion, ice temperature, fluid temperature, time, intensity of solar radiation, angle of solar radiation, and absorption of solar radiation. Using dimensional analysis it is possible to transform these variables into dimensionless variables. The equations that model force and mass loss will then take the form: force/fluid density*gravity acceleration*control length^3= function(other dimensions/control length, density of ice/density of fluid, density of fluid*velocity*control length/viscosity, velocity^2/gravity acceleration*control length) (Mass loss^2)*ice density*heat of fusion^3/(thermal conductivity*time)^3*temperature of ice^3= function(heat of fusion/specific heat*ice temperature, specific heat*ice density*control length^2/thermal conductivity*time, specific heat*viscosity/thermal conductivity, temperature of fluid/temperature of ice, angle of solar radiation, absorption of solar radiation) For example, for modelling a 2000 m long, 900m wide and 750m deep berg, the corresponding model dimensions would be1 by 0.45 by 0.38 m and the model would weigh 150 kg which is a manageable laboratory size. Aircraft models are tested in wind tunnels. Using a corresponding procedure the above measurements for icebergs could be conducted in a water channel. The model could be mounted in a harness that would permit the recording of forces and moments and water and air moved past the model with controlled velocities and directions. Air and water temperatures would have to be adjusted to the appropriate values for the geographic location. The solar radiation will be harder to simulate but overhead lamps of proper intensity are optimal for this purpose. With the scale of 2000 used in the example a 200 day towing period could be simulated in 4 and a half days. Iceberg Utilization Part B- Propulsion Paddle-Wheels A paddle wheel consists of one or several paddles that are in automated circular motion such that there is a force exerted on the water, the reaction of which propels the vessel.The conventional paddle-wheel has been utilized successfully only in calm water. They cannot work successfully in open seas. The idea of a new paddle-wheel which is able to run underwater was proposed by Mohamad Al-Faisal (Al-Faisal, 1978). A number of such paddle-wheels will be attached to the iceberg in both sides and immersed in the sea. Their power supply will originate from power generation units located either on top of the iceberg or provided by ships accompanying the iceberg. By varying the speed of rotation of the paddle-wheel on one side one can cause the proper torque to send the iceberg on the designated route. Tabular icebergs of regular shapes and suitable sizes will be chosen for this procedure. Mainly smooth tabular icebergs will be chosen as they prove! to be more convenient. Transportation of the pilot iceberg from the time it has been selected until it reaches the mooring sites will pass through phases. At first, there is the job of selecting it and dragging it away from the place from where it has been spotted to a place where there are better prospects of increasing its propulsion. The hydrodynamic drag times the velocity gives the power that is dissipated in the iceberg weight. The resulting power turns out to be 13 megawatts.
Paddle-wheel configuration (Husseiny, 1978)
Paddle-wheel configuration (Husseiny, 1978)
Side view (Husseiny, 1978)
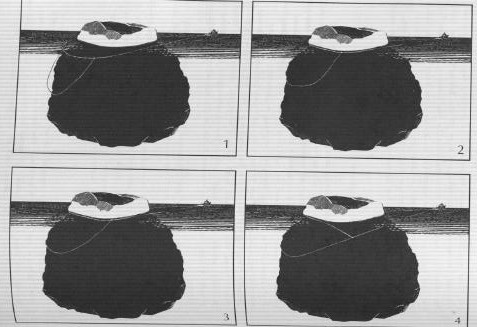
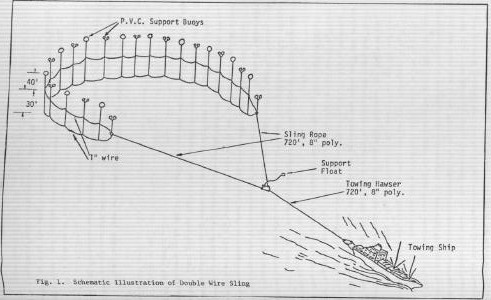
Towing of Small Icebergs The conventional method of transporting icebergs involves towing them with tugboats. According to a study completed in this field (Benedict, 1978), the towing method employed to date involves attaching a 4-inch pulley polypropylene around the iceberg around the water line and applying between 10,000-70,000 lbs of force. The method may fail for smaller unstable and or dome-shaped icebergs. This is why the selection of the iceberg needs to be done with great care. However, this limitation can be overcome by design modifications of the towing techniques in which the towing force is applied through the center of mass of the berg. One such proposed technique is the tirice constant which consists of three members: a floating member, an elastic member, and a submerged member. The elastic member ensures proper static and dynamic of the other two members while minimizing rotational torque.
Iceberg prepared for towing (Husseiny, 1978)
Iceberg being towed by tugs (Husseiny, 1978)
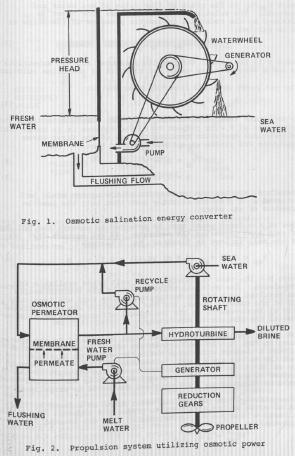
Osmotic Propulsion of Icebergs An alternative approach is to utilize a form of solar power specifically the difference in osmotic pressure between seawater and meltwater from icebergs (Davis, 1978). In essence, this method of transportation derives its energy from the creation of a gradient between the heat of the iceberg and its surrounding environment. Even if an iceberg is wrapped in a protective film there will still be considerable melting of the ice during transportation. Since long-term containment of the meltwater is probably impractical we will have to assume that this water will be discarded. However, if the meltwater can be diverted to an osmotic propulsion system, its considerable potential energy will come to use. The osmotic pressure of seawater at ocean temperature is about 23 ATM. When seawater and freshwater are separated by a semi-permeable membrane, osmotic pressure forces the freshwater through the membrane into the seawater and causes its volume to expand! . This expansion can be used to drive a turbine or it can be released through a jet to propel the iceberg.
Osmotic Pump which forces freshwater to generate an energy gradient (Husseiny, 1978)
The Self-Propelled Iceberg The idea of icebergs migrating on their own to locations of interest is not entirely new. Fuhs proposed to create a self-propelling iceberg in 1978 (Fuhs, 1978). The concept of a self-propelled iceberg is developed using a thermodynamic cycle similar to ocean thermal energy conversion. Calculations show that a propulsion rod developing two Mega-Newtons thrust requires a power of 6.8 Megawatts in an ideal cycle. The diameter of the ideal rod was calculated by Fuhs to be 23 meters. For a transit from Antarctica to Los Angeles, 1.6 % of the iceberg is converted to water as a result of power extraction. Large icebergs require bollard pull of 100,000-10 million newtons. In terms of some relative statistics, the largest US Navy tugs have a bollard pull of 500,000 newtons while commercial tugs can be constructed to have a bollard force of 1,200,000 newtons. Several tugs are required to tow one large iceberg. The fuel consumption is on the order several ! million dollars for a journey from Antarctica to the US. To tow the iceberg, several of the world's largest tows are needed. Fuel for the tugs adds considerably to the cost of transporting the ice. As an alternative, the energy available from the difference between seawater temperature and ice temperature can be used. Ammonia or propane can be used as the working fluid in the thermodynamic cycle. Warm seawater enters the propulsion pod. In the boiler, heat is transferred to the ammonia. After extracting the power in the turbine the ammonia is condensed in the condenser located in a pool of fresh water. 10 million pounds of thrust are needed at 2.4 knots. The horsepower required is 77,300 horsepower. 10 propulsion pods of 75 feet radius will be needed. 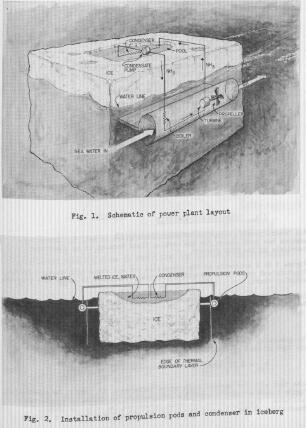
Iceberg self-propulsion through a self power-plant. (Husseiny, 1978)
A technique is proposed to insulate iceberg using foam plastic (Frisch and Kresta, 1978). The use of foam is superior to plastic wraps because of ease in application, better insulation properties, and better stability in transit. Polyurethane foam has been a favorable option among scientists since it has the least thermoconductivity of all known insulating foam materials. It has been suggested that polyurethane foam can be sprayed on the surface of the iceberg by specially built equipment which can operate underwater by remote control. The foam can be applied so as to conform to the uneven surfaces. Open-cell and closed-cell construction are the two types of considered foam insulation. Without insulation the mass lost during transportation will happen at a rate of 145.9 kg/sec, the volume loss = 0.166 m^3/sec → 0.00013457839 acre-feet/sec. We would like to reduce that as much as possible. Cost of Transporting Icebergs on Water Due to the small focus of research into the field of iceberg utilization, no large-scale cost projections are readily available. Iceberg Utilization and Transport through water will be much easier to organize than a pipeline and processing plants.
For a Successful Harvesting of Glacial Icebergs:
|

|