|
Geology Navigation |
||
|
Geology Main Page Core Samples Temperature/Chemical Data Dye Injection Test Other experiments Lab Timeline Tools |
||
Atlantis II Dye Experiment
Tracer tests involve releasing some sort of dye at a source and tracking its dispersion over time. In industry, they are often used to find leaks. In environmental studies, the tracer test is an excellent method of mapping subsurface water flow.
Factors that affect subsurface water flow are varying flow media (different kinds of rocks, strata, fractures, etc.) and chemical interactions between solutes and the media. It is difficult to directly observe these factors, so the tracer test is a key tool for geologists and environmental engineers.
There are at least six types of commonly used tracer tests: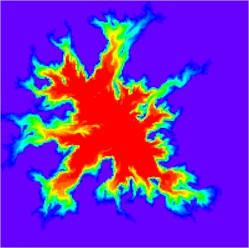
Simulation of tracer distribution after injection into a heterogeneous medium.
(source http://www.sandia.gov/eesector/gs/gh/tracer.html)
According to our mentor, Dr. Hart, "a tracer release experiment would be very feasible as a way to learn about water movement. I've never understood why no one has ever done this yet!" Although there are enormous difficulties with conducting a tracer experiment, the potential data yield is equally great. Some such problems involve finding downflow zones (so that the dye will penetrate rather than return to the surface), interpreting results indicative of extremely complex currents, and establishing a method to trace the dye. Also, how can the dye be injected? What can be learned by releasing the dye above the seafloor?
In order to use the minimal amount of dye possible, visible detection (just "seeing" the dye) will not be an option. Fluorometers, installed in AUV's and in a sensor array, will be able to detect concentrations of the dye in desired areas. Detection limits for fluorometers can go all the way down to 20 picograms of dye per gram of water.
Procedure
Before dye can be released, two things have to happen: a preliminary survey of the area to determine potential injection and release sites, and the setup of the sensor array. Since the main focus of the tracer test is to gain information about diffuse hydrothermal fluid flow, a variety of sites will have to be used.
Example dye injection unit