|
Working with Graphs
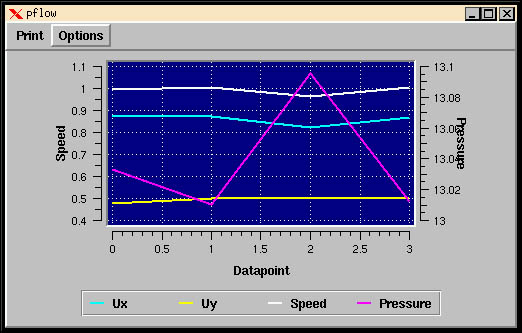
It is only possible to display one
graph for each layout. On
this graph it is possible to plot four quantities for every
data point. These quantities are horizontal and vertical
velocity, speed, and pressure.
Note: The x-axis of
the graph is graphed by point, in the order that the data
points appear in the data point table - not the x coordinate!
It is possible to print the graph by selecting the Print menu from the graph window's menu.
From the print dialog that appears, you can print the graph to
a file to be sent to a printer or included in a document.
Continue
|
