
|
| About O.R.C.A. |
| >>Home |
| >>The Team |
| >>Articles & Press |
| >>Orca Brochure |
| >>Our Sponsors |
| >>Contact Us |
| >>Join ORCA<<<<<<<< |
| Competitions |
| >>2006 Summer |
| >>2005 <3rd Place> |
| >>2004 <1st Place> |
| >>2003 <4th Place> |
| >>2002 <1st Place> |
| >>2001 <1st Place> |
| >>2000 <2nd Place> |
| >>1999 <1st Place> |
| >>1998 <1st Place> |
| Technical Info |
| >>ORCA VIII (NEW) |
| >>ORCA VII |
| >>ORCA IV |
| >>ORCA II & III |
| >>ORCA I |
| Photo Albums |
| >>2005 Competition |
| >>2004 Competition |
| >>2003 Competition |
| >>2002 Construction |
| >>2002 Competition |
| >>2001 Construction |
| >>2001 Competition |
| >>2000 Competition |
| >>1999 Competition |
The ORCA VII Vision SystemThe vision system receives a color raster image from the Orca's downward-pointing camera at periodic intervals. The goal is to analyze the image and determine the existence, position, and orientation of any rectangular bins in the field of view. The image is first transformed from its original colorspace and resolution into a grayscale raster consisting of a more manageable number of pixels. The colorspace transformation is chosen to emphasize the white six-inch rims around the bins. The edges of this white region, especially those that bound the dark bin interiors, are likely to be by far the sharpest, straightest, and generally most significant edges in the image. Furthermore, they are all mutually parallel or perpendicular, so that once an overall axis orientation is chosen, only two edge orientations (parallel to the two axes) are of interest. Filters are first applied to the source image (a) to determine the x and y directional derivatives of the image considered as an intensity function of x and y. The filters are convolution kernels calculated by taking the x- and y-derivatives of a two-dimensional Gaussian. The kernels are x-y separable, meaning that each can be applied using a series of two one-dimensional convolutions (for a speed boost), and they are steerable, meaning that they are a basis for a set of directional derivative filters for all directions that can be obtained by linear combination. The results of applying the two derivative filters are two signed rasters (b) holding the derivatives for each pixel. Together they define a gradient vector for each pixel.
It then remains to consider combinations of these lines as possibly bounding bin interiors. A proper set of four edges must obey many constraints, including edge sign (opposite edges must have opposite sign), bin size (compared to expectations based on the Orca's other sensors), bin aspect ratio, gradients across the edges, and brightness and consistency of the bin-interior region of the image. Bin candidates are identified and ranked using a confidence measure based on these criteria, and likely bins are reported. |
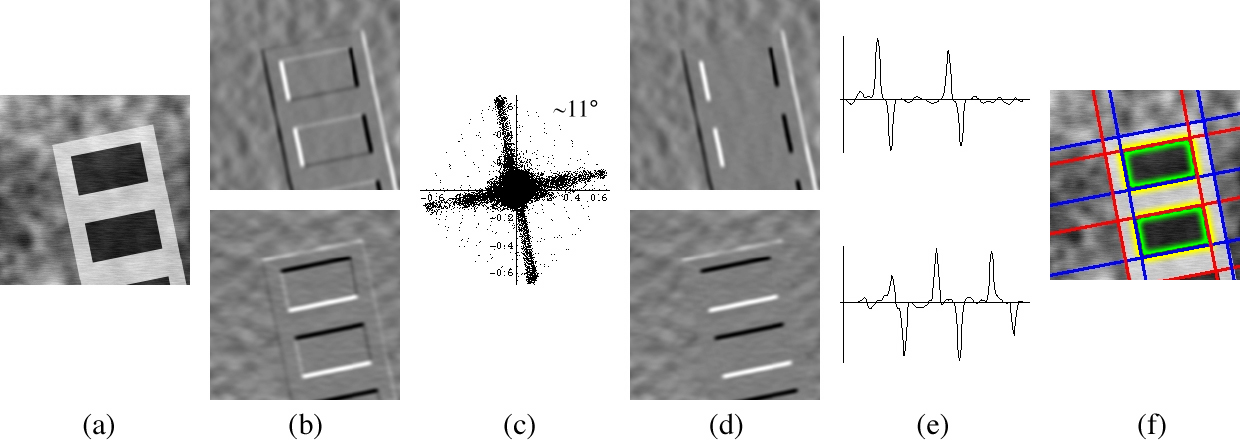 Plotting these gradients (c) clearly reveals the dominant orientation
of the edges in the image. The software detects this orientation by
combining the vectors using two orthogonal quarter-turn symmetric
weighting functions. Using this new information, the x- and
y-derivative rasters can be combined to yield two new orthogonal
directional derivative rasters (d), this time specifically emphasizing
edges in line with the detected orientation. The next step is to
detect the individual locations of the strongest edges, and for
simplicity the software works with mathematical lines rather than
segments. Since only a single line orientation is of interest for each
raster, the rasters can be collapsed along this direction into
one-dimensional functions (e). The most prominent extrema of these
functions (found by looking for zero-crossings of their derivatives)
are recorded as edge-line candidates (f, red and blue).
Plotting these gradients (c) clearly reveals the dominant orientation
of the edges in the image. The software detects this orientation by
combining the vectors using two orthogonal quarter-turn symmetric
weighting functions. Using this new information, the x- and
y-derivative rasters can be combined to yield two new orthogonal
directional derivative rasters (d), this time specifically emphasizing
edges in line with the detected orientation. The next step is to
detect the individual locations of the strongest edges, and for
simplicity the software works with mathematical lines rather than
segments. Since only a single line orientation is of interest for each
raster, the rasters can be collapsed along this direction into
one-dimensional functions (e). The most prominent extrema of these
functions (found by looking for zero-crossings of their derivatives)
are recorded as edge-line candidates (f, red and blue).
 Copyright 1998-2006 MIT.
Last updated on January 27, 2006.
Contact us at orca@mit.edu