Diffuse Reflectance Spectroscopy (DRS)
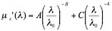
Diffuse Reflectance Spectroscopy (DRS) is a spectroscopic techniques developed by the MIT Spectroscopy Laboratory which uses the diffusion approximation to analyze tissue reflectance spectra. The diffusion approximation model developed by Zonios et al.[1] extracts properties such as the reduced scattering coefficient, µs´, and the absorption coefficient, µa. An analytical expression was used to describe µs´:
|
[mm-1], |
(1) |
where the wavelength, λ, is expressed in units of microns and λ0 is equal to 0.7 µm. The A parameter is related to the scatterer density, and the B parameter is related to the size of the Mie scatterers. The first term on the right-hand side of this expression has been commonly used by other researchers to model scattering from cells and tissues. We have observed that the second term was required to accurately model reflectance at shorter wavelengths (<400 nm), in which scattering from Rayleigh particles is significant. Typically, reflectance spectra are fit over the range of 350-750 nm using a constrained nonlinear least-squares fitting algorithm, although other faster and more accurate optical property determination algorithms have been recently developed.
The absorption coefficient was modeled as the sum of the hemoglobin and β-carotene absorption coefficients as follows:
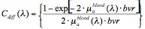
The absorption coefficient of hemoglobin was modified by a correction factor to account for the fact that hemoglobin is confined to blood vessels, rather than homogeneously distributed in the tissue.[2] This effect, called vessel packaging, is caused by the fact that blood vessels are opaque to 420 nm light which is strongly absorbed by hemoglobin, but become more transparent to longer wavelengths of light. As a result, the Soret band (420 nm) is reduced relative to that of the weaker hemoglobin absorption bands. We used the correction factor Cdiff (λ, bvr) developed by van Veen et al.[3] and Svaasand et al.[4] to account for the effects of vessel packaging:
|
(3) |
where bvr is the effective blood vessel radius in units of mm, and µablood(λ) is absorption coefficient of whole blood in units of mm-1, given by:

|
(4) |
where α is the oxygen saturation of hemoglobin, and εHbO2 and εHb are the well known extinction coefficients of oxygenated and deoxygenated hemoglobin.[5] We assume that hemoglobin concentration of whole blood is 150 mg/mL, and impose a lower limit of 2.5 µm for bvr since the minimum diameter of a capillary is on the order of 5-7 μm.[6] The absorption coefficient of hemoglobin, µaHb, is then given by the expression:

|
[mm-1], |
(5) |
where ν is the volume fraction of blood sampled and is described by the ratio:

|
(6) |
with [Hb] the total concentration of hemoglobin in units of mg/mL. The absorption coefficient of hemoglobin, µaβ-car, is given by:

|
(7) |
where [β-car] is the concentration of β-carotene in mg/ml, and εβ-car is its extinction coefficient.[7]
References
1. G. Zonios, L. T. Perelman, V. M. Backman, R. Manoharan, M. Fitzmaurice, J. Van Dam and M. S. Feld, "Diffuse reflectance spectroscopy of human adenomatous colon polyps in vivo," Applied Optics 38 (31), 6628-6637 (1999).
2. C. Lau, O. Scepanovic, J. Mirkovic, S. McGee, C.-C. Yu, S. Fulghum Jr., M. Wallace, J. Tunnell, K. Bechtel and M. S. Feld, "Re-evaluation of model-based LSS for tissue spectroscopy," Journal of Biomedical Optics (2008).
3. R. L. P. van Veen, W. Verkruysse and H. J. C. M. Sterenborg, "Diffuse-reflectance spectroscopy from 500 to 1060 nm by correction for inhomogeneously distributed absorbers," Optics Letters 27 (4), 246-248 (2002).
4. L. O. Svaasand, E. J. Fiskerstrand, G. Kopstad, L. T. Norvang, E. K. Svaasand, J. S. Nelson and M. W. Berns, "Therapeutic response during pulsed laser treatment of port-wine stains: Dependence on vessel diameter and depth in dermis," Lasers in Medical Science 10 (4), 235-243 (1995).
5. S. Prahl, "Optical Absorption of Hemoglobin,"
6. C. H. Best, N. B. Taylor and J. B. West, Best and Taylor's physiological basis of medical practice, Williams & Wilkins, Baltimore (1991)
7. H. Du, R. C. A. Fuh, J. Z. Li, L. A. Corkan and J. S. Lindsey, "PhotochemCAD: A computer-aided design and research tool in photochemistry," Photochemistry and Photobiology 68 (2), 141-142 (1998).

|
 |