Massachusetts Institute of Technology Spectroscopy Home   search
Research in Biomedical Optics

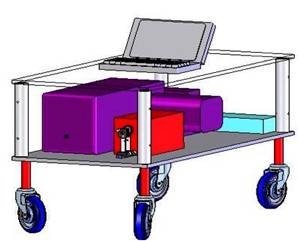
Raman Clinical Instrument

http://web.mit.edu/spectroscopy/images/spacer.gif
Raman clinical instrument is capable of collecting Raman spectra from biological tissues over the fingerprint range (400-1960 cm-1).
1st  image
Figure 1.Schematic of clinical Raman instrument.

The new Raman system will measure approximately 32” x 17” x 10” and sit on a low wheeled platform. The instrument uses an 830 nm diode laser, delivered through the probe, to excite Raman scattering. The probe delivers to and collects light with the probe tip in contact with tissue. Light from an 830 nm InGaAs diode laser (Process Instruments, Salt Lake City, UT) is passed through a holographic band pass filter centered at 830 nm (Kaiser Optical Systems Incorporated, Ann Arbor, MI). The light is then collimated and coupled into the 200 μm core diameter excitation fiber of the Raman probe. Illumination of the sample is gated by a high-speed, 6 mm aperture, computer-controlled shutter (LS6ZM2, Vincent Associates, Rochester, NY). The excitation fiber is terminated with an FC connector to provide day-to-day reproducibility of alignment. For 100 mW of excitation power, the resultant irradiance is 318 W/cm2 which has been clearly shown to not cause any tissue damage. The proximal end of the probe contains the collection fibers that are arranged in a vertical array and serve as the entrance slit to the spectrograph (Holospec f/1.8i, Kaiser Optical Systems), attached by means of a modified BNC connector. The collected Raman light is dispersed onto a back-illuminated, deep-depletion CCD detector with a 1024×256 array of pixels. The CCD detector is thermoelectrically cooled to -70oC. The probe is 4 m long and is 2 mm in overall diameter. Integrated software (LabVIEW and MATLAB) in the system enables rapid collection of Raman spectra (1s) and real-time analysis of the spectral parameters.
2nd image
Figure 2. Typical Raman spectrum acquired in 0.5s from breast tissue.

Recent Publications

  1. A. S. Haka, Z. Volynskaya, J. A. Gardecki, J. Nazemi, R. Shenk, N. Wang, R. R. Dasari, M. Fitzmaurice, and M. S. Feld, “Diagnosing breast cancer using Raman spectroscopy: prospective analysis”, J. Biomed. Opt. 14, 054023 (2009), DOI:10.1117/1.3247154
  2. O. R. Scepanovic, Z. Volynskaya, C. R. Kong, L. H. Galindo, R. R. Dasari, and M. S. Feld, “A multimodal spectroscopy system for real-time disease diagnosis”,Rev. Sci. Instrum. 80, 043103 (2009), DOI:10.1063/1.3117832
  3. A. S. Haka, Z. Volynskaya, J. A. Gardecki, J. Nazemi, J. Lyons, D. Hicks, M. Fitzmaurice, R. R. Dasari, J. P. Crowe and M. S. Feld, "In vivo margin assessment during partial mastectomy breast surgery using raman spectroscopy," Cancer Res 66 (6), 3317-3322 (2006) URL: http://cancerres.aacrjournals.org/cgi/reprint/66/6/3317.pdf.
  4. A. S. Haka, K. E. Shafer-Peltier, M. Fitzmaurice, J. Crowe, R. R. Dasari and M. S. Feld, "Diagnosing breast cancer by using Raman spectroscopy," Proc Natl Acad Sci U S A 102 (35), 12371-12376 (2005) PMCID: PMC1194905.
  5. O. R. Scepanovic, M. Fitzmaurice, J. A. Gardecki, G. O. Angheloiu, S. Awasthi, J. T. Motz, J. R. Kramer, R. R. Dasari and M. S. Feld, "Detection of morphological markers of vulnerable atherosclerotic plaque using multimodal spectroscopy," J Biomed Opt 11 (2), 021007 (2006).
  6. J. T. Motz, M. Fitzmaurice, A. Miller, S. J. Gandhi, A. S. Haka, L. H. Galindo, R. R. Dasari, J. R. Kramer and M. S. Feld, "In vivo Raman spectral pathology of human atherosclerosis and vulnerable plaque," J Biomed Opt 11 (2), 021003 (2006).