FastEEM
Motivation
Reflectance and fluorescence spectroscopy have shown great promise for early detection of epithelial dysplasia. We have developed a clinical reflectance spectrofluorimeter for multimodal spectroscopic diagnosis of epithelial dysplasia. This clinical instrument, the FastEEM reflectance spectrofluorimeter (Figure 1), is a device that collects both laser-induced fluorescence excitation-emission spectra, and white light reflectance spectra - all within a fraction of a second. Because the FastEEM system employs pulsed light sources and gated detection, motion artifacts and distorting effects of ambient light are eliminated. These features make it compatible for use in standard clinical procedures, where white light illumination is always present (e.g. in the case of endoscopy).
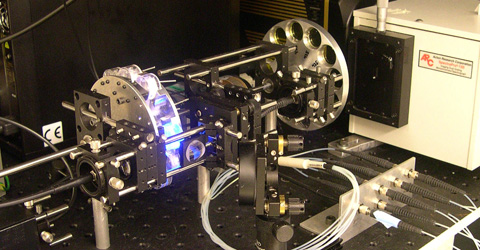 |
Figure 1. FastEEM reflectance spectrofluorimeter. |
Opto-mechanical system
The FastEEM delivers a sequence of ten laser pulses (308 – 480 nm) and two white light pulses to the tissue via an optical fiber probe. The same probe collects the white light reflectance and fluorescence and delivers it to the entrance slit of the diffraction grating, where it is dispersed onto an intensified CCD detector. All ten laser-induced emission spectra and the two white light reflectance spectra are collected in approximately 0.3 s. A schematic of the system is shown in figure 2.
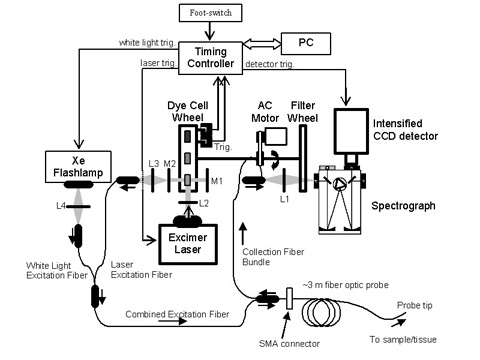 |
Figure 2. Schematic layout of the FastEEM clinical spectrophotometer. L1, L2, L3, L4 are lenses. M1 and M2 are mirrors. |
This short acquisition time is achieved using a set of rapidly rotating wheels driven by an AC motor at just over 3 Hz. The laser lines between 342 – 480 nm are generated using a set of dye lasers, while the 308 nm laser line comes directly from a XeCl excimer laser. The two white light spectra are generated using a Xe Flashlamp. As each dye cell traverses the common optical cavity, it is pumped by the XeCl excimer laser. In addition, as the prism traverses the optical cavity, the XeCl excimer laser is triggered and the laser pulse is redirected into the laser excitation fiber. The white light and the laser excitation fibers are combined into one fiber and guided to the optical fiber probe. As the collected light returns through the collection fibers, it is focused onto the entrance slit of the spectrograph. The “filter wheel” spins in synchronization with the dye cell wheel. This filter wheel holds the long pass filters that remove the excitation line from the collected light.
The FastEEM collects two white light reflectance spectra to obtain an accurate reflectance spectrum over the broad wavelength range from 300 – 800 nm. The white light source has significant intensity from 270 nm to greater than 800 nm. The spectrograph operates in the first order of diffraction, so that the longest wavelength it can collect is twice the shortest wavelength, providing a range from 270 – 540 nm. In order to avoid light in the second order of diffraction above 540 nm, the FastEEM collects a second reflectance spectrum using a long pass filter (420 nm) to remove the short wavelengths. The amplitude of the filtered spectral response is adjusted in software to match that of the unfiltered response in the region between 460 and 530 nm, and these two white light spectra are merged (at 500 nm) to create one continuous spectrum from 300 – 800 nm (Figure 3.)
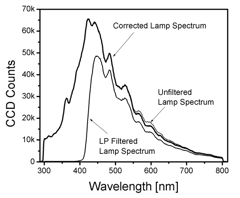 |
Figure 3. Spectrum of the FastEEM white light source (Xe Flashlamp) reflected off of a 20% reflectance standard. The corrected lamp spectrum represents the merging of two lamp spectra, the unfiltered lamp spectrum below 500 nm and the amplitude adjusted long pass (LP) filtered lamp spectra. This effectively avoids signals in the final spectra from light diffraction in the second order. |
Probe Design
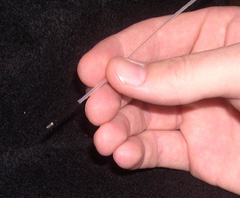
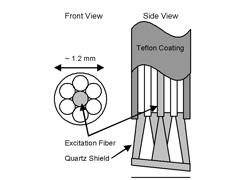
The fiber optic probe resembles a flexible catheter with an overall length of over 3 m and a diameter of approximately 1.2 mm (Figure 4 (a)). This small diameter enables it to be inserted in the accessory channel of a standard endoscope. The distal tip consists of seven 200 ?m core multimode optical fibers (NA = 0.22) (in a six around one configuration, Figure 4(b)) which are fused together to form an optical shield approximately 1 mm long. The central fiber transmits the excitation light, while the six surrounding fibers collect light from the tissue and deliver it back to the entrance slit of the spectrograph. This arrangement of fibers and quartz shield provide a fixed geometry of overlapping excitation and collection cones, creating a sampling spot on the tissue surface with a diameter of approximately 800 ?m. The quartz shield is beveled at 17o to reduce internal reflections from the probe-air interface. The proximal end of the catheter is terminated at seven SMA connectors, allowing for simple and quick changing of the optical fiber probes. One SMA connector leads to an optical fiber beam-splitter, where one fiber is split into two for each of the excitation sources. This greatly simplifies the alignment of the system in that the white light and the laser light can be aligned separately. The remaining six collection fibers lead from the SMA connector to the entrance slit of the spectrograph, where they are arranged linearly and parallel to the slit. The quartz shield in this probe design allows for the collection of tissue fluorescence and diffusely scattered light as well as light scattering in a small range of angles in the backward direction.
|
|
Figure 4. (a) Photograph and (b) schematic diagram of the distal tip of the optical fiber probe. |
Software Control and Data Calibration
All systems of the FastEEM are controlled from a portable computer using custom software developed in the graphical programming environment LabView Data acquisition can be initialized either by the pressing a push-key within the program or by using a footswitch, providing control to the physician acquiring the data. In addition, the control software handles all data calibration, enabling on-line (i.e. real-time) data acquisition and calibration. This helps provide an immediate check upon the quality of the data. Background calibration is used to remove effects of CCD dark currents and stray light. The wavelength is calibrated by recording a spectrum from a mercury lamp. The intensity of each dye laser is inherently different from one another, and the individual dye laser intensities vary slightly from day to day due to optical alignment and dye degradation. We correct each EEM for excitation intensity by measurement of a standard rhodamine B dye mixture (8 g/L, ethylene-glycol). The known quantum yields of rhodamine B are then used to correct the intensity of each emission spectrum. White light reflectance is calculated by dividing the background corrected tissue spectrum by that of a reflectance standard (20% reflectance standard, Labsphere Inc., North Sutton, NH).
Recent Publications
- Tunnell JW, Desjardins AE, Galindo L, Georgakoudi I, McGee SA, Mirkovic J, Mueller MG, Nazemi J, Nguyen FT, Wax A, Zhang Q, Dasari RR, Feld MS. "Instrumentation for Multi-modal SpectroscopicDiagnosis of Epithelial Dysplasia." Technol Cancer Res Treat 2(6):505-14, 2003.
- M. G. Muller, A. Wax, I. Georgakoudi, R. R. Dasari, and M. S. Feld. "A reflectance spectrofluorimeter for real-time spectral diagnosis of disease." Rev. Sci. Instr. 73, 3933-3937, 2002. Zângaro, R.A., L. Silveira, et al.," Rapid multiexcitation fluorescence spectroscopy system for in vivo tissue diagnosis." Applied Optics 35:5211-5219, 1996.


|
 |