Confocal Raman & quantitative phase microscopy
Introduction
Live cell imaging without staining is important in biological studies. Techniques such as phase contrast and Nomarski/DIC microscopy have overcome this problem by transforming the phase information into intensity distribution and thus reveal the intra-cellular structural details. Recently, quantitative phase microscopy based on interferometry has been developed as a new technique for quantitative biology. The refractive index obtained from quantitative phase and hence the information of optical path length in a cell can be used to obtain the detailed morphological structure in 2D and even in 3D. Fast acquisition and full-field quantitative imaging without exogenous agents are the primary advantages of the quantitative phase contrast microscopy methods. The 2D and 3D mapping of refractive index gives the microscopic structure (organelles such as mitochondria, nucleotides etc) of the cell under investigation while confocal Raman could give biochemical information at any point of interest.
Since it was first observed in 1928, Raman scattering has been widely used as an analytical tool in many fields of science, engineering and industry. Very weak inelastically scattered light from the sample represent “fingerprint” vibrational information of the molecules in the sample which can be used for both qualitative and quantitative analysis. Incorporating confocal microscopy, which is extensively used to obtain three-dimensional information, along with conventional Raman spectroscopy provides an exciting research avenue, due to the possibility of obtaining accurate information about the chemical and morphological components with high spatial resolution. This can be further augmented by standard reflectance and fluorescence modalities. Despite its great promise, confocal Raman microscopy has not been widely used for biological research, in comparison to fluorescence imaging, due to its intrinsically weak signals.
Experimental Setup
The setup (Fig. 1) is based on a home-built inverted microscope and a typical scanning mirror confocal system, which accommodated both confocal reflectance and confocal Raman setups. White LEDs (not shown) are used as an illuminating source for a video camera to ensure the sample in the field of view (FOV) and in focus. Due to the transparent nature of a living cell, the known oblique illumination technique is utilized to enhance the cell’s features and used as a gold standard for comparison. Frequency-doubled Nd:Yag laser (Millennia 5sJ, Spectra-Physics) at 532 nm is used as a pumping source for CW tunable Ti:Sapphire Laser (3900S, Spectra-Physics). The output of Ti:Sapphire laser is tuned to 785 nm and used as an excitation source for both confocal reflectance and confocal Raman systems. To obtain high resolution for cellular imaging, as well as confocal reflectance, the setup uses an oil immersion objective lens (Zeiss Plan-NeoFluar 100X/1.30). A flip mirror is installed after the tube lens so that a focused image of the sample plane can be observed at the video camera with ~121x magnification.
The collimated beam is filtered by a band pass filter and then redirected to the dual axes galvanometer mirrors (CT-6210, Cambridge Technology) by a dichroic mirror, DM1. After the galvanometer mirrors, a telescopic lens system is used to optimize the beam size and relay the beam. Coarse and fine adjustments of sample focus is digitally controlled by a piezo-actuator combined with a differential micrometer (DRV517, Thorlabs).
During laser illumination, refractive index gradients in a sample give rise to the confocal reflectance signal, while the molecular bonds in the sample give rise to the spontaneous Raman signal. Both signals travel and retrace the excitation beam path and pass through the first dichroic mirror (DM1). The remaining Rayleigh scattered photons after the first dichroic mirror is filtered again by the second dichroic mirror and acquired as a confocal reflectance signal. Both confocal reflectance and confocal Raman signal are collected by a standard multimode fiber, whose core size is optimized for the resolution and signal strength. Furthermore, the confocal reflectance image, which is optically registered with the confocal Raman image during scan, can be used to digitally coregister with the bright field image for comparison.
Confocal Raman signal is delivered to imaging spectrograph (HoloSpec f/1.8i), whose spectral output is captured by a liquid nitrogen cooled CCD (LN/CCD-1340/400-EB, Roper Scientific). The confocal reflectance signal is delivered to a photomultiplier tube (PMT, H9656-20, Hamamatsu), whose photoelectric output is amplified by a PMT signal conditioner. Data acquisition board (NI PCI-6251) and Labview (National Instruments) are used to control the galvanometer mirror scan and data acquisition.
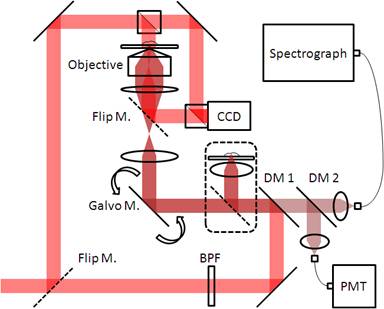
Fig. 1. Confocal Raman/quantitative phase microscopy setup
To obtain the quantitative phase microscopy (QPM) measurements, a Mach-Zehnder interferometer is integrated into the setup. Using a flip mirror, the same reflected laser beam can be used as an illumination source for the QPM. A beam splitter is placed before the sample to divide the incoming beam into the object and reference beams, respectively. While the object beam travels through the same beam path as the bright field image, the reference beam travels the outer perimeter. Later both beams are brought back and interfered in front of the CCD camera. Using Hilbert transformation, the optical path length information of the sample is extracted from the interferogram.
Results
Red blood cells (RBCs) are selected as samples for validating and demonstrating the capability of the system since their homogeneous property and simple structure can provide both morphological (biconcave) and chemical (hemoglobin) information. Blood smear is prepared on top of a quartz coverslip (Fig. 2(a)). QPM image shows the three-dimensional shape of the blood smear in Fig. 2(b). Refractive index difference between the RBCs and the surrounding air generates different optical path lengths, which are measured by the interferometric technique. From the QPM information, RBCs with abnormal shapes can be quickly screened. The abnormal shape of RBC can be an important marker for several blood disorders. For demonstration purposes, a randomly selected RBC is subjected to Raman mapping. The spatial distribution of hemoglobin is shown in Fig. 2(c) which can be observed to show good correlation with the RBC shape obtained from QPM. This Raman mapping provides complementary chemical information of the cell, which can also be related to the disease states. Similar to the QPM image, the three-dimensional shape of RBC is reconstructed from the hemoglobin contents (Fig. 2(d)).
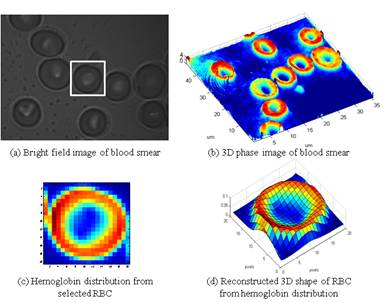
Fig. 2. Multimodal images from confocal Raman/QPM system.
|
 |