Quantitative Microscopy and Tomography of Live Cells
Dispersion Phase Microscopy
Refractive indices of biomolecules are fundamental properties that play key roles in a number of optical imaging and microscopy techniques, which include optical coherence tomography, confocal reflectance microscopy, light scattering spectroscopy, and quantitative phase microscopy [1]. The refractive index of a material is wavelength dependent, which is known as the dispersion property of the material. There have been a few interesting studies utilizing the refractive index dispersion of biomolecules to quantify molecular concentration. For example, the dispersion of hemoglobin was used to extract the concentration of hemoglobin in intact red blood cell [2]. In another study, the dispersion of an exogenous dye was used to decouple refractive index measurement from height measurement of cells in digital holographic microscopy [3]. Previously we have shown that proteins exhibit substantial dispersion near their absorption peak at 280 nm [4]. Recently, for the first time within our knowledge, we reported dispersion imaging of living eukaryotic cells in the NUV range using quantitative phase microscopy [5].
Figure 1 shows the optical path difference (OPD) of HeLa cells for two different wavelengths (310, 400nm), and the ratio of the OPDs averaged over each cell and each wavelength. The average dispersion R of the 54 measured HeLa cells is 1.088 with a standard deviation of 0.013. This number is very close to the dispersion of pure protein solutions at a ratio of 1.089.
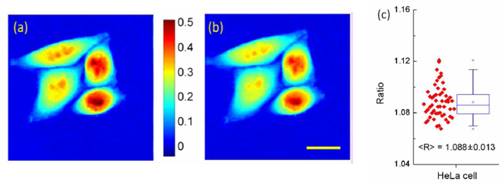
Figure 1. Dispersion of HeLa cells. (a),(b) optical path difference of HeLa cells at (a) 310nm and (b) 400nm, (c) dispersion of 54 HeLa cells based on the ratio of the optical path differences averaged over each cell and each wavelength. Scale bar: 20 μm [5].
To observe the dispersion of other biomolecules, we need to enhance the signal from other biomolecules or to suppress the noise. To lower the wavelength would be one solution to enhance the signal from DNA, but the damage to a sample would be more serious. Using the tomographic phase microscopy, we can suppress the laser speckle noise and enhance refractive index sensitivity, which may enable the quantification of DNA content in a live cell.
- T. Vo-Dinh, Biomedical Photonics Handbook (CRC Press, 2003).
- Y. Park, T. Yamauchi, W. Choi, R. Dasari, and M. S. Feld, “Spectroscopic phase microscopy for quantifying hemoglobin concentrations in intact red blood cells,” Opt. Lett. 34(23), 3668–3670 (2009).
- B. Rappaz, F. Charrière, C. Depeursinge, P. J. Magistretti, and P. Marquet, “Simultaneous cell morphometry and refractive index measurement with dual-wavelength digital holographic microscopy and dye-enhanced dispersion of perfusion medium,” Opt. Lett. 33(7), 744–746 (2008).
- D. Fu, W. Choi, Y. Sung, S. Oh, Z. Yaqoob, Y. Park, R. R. Dasari, and M. S. Feld, “Ultraviolet refractometry using field-based light scattering spectroscopy,” Opt. Express 17(21), 18878–18886 (2009).
- D. Fu, W. Choi, Y. Sung, Z. Yaqoob, R. R. Dasari, and M. Feld, “Quantitative dispersion microscopy,” Biomed. Opt. Express 1, 347–353 (2010).
|
 |