Quantitative Microscopy and Tomography of Live Cells
Line-field Reflection Phase Microscopy
In the past, both spectral-domain as well as time-domain optical coherence tomography (OCT) based implementations of reflection phase microscopy have been reported [11, 30, 49, 74-75]. Although common-path designs provide superior phase stability, the point illumination compromises the spatial resolution by requiring relatively low-NA microscope objectives to simultaneously focus at the sample and reference reflectors. The desire to develop a multi-point reflection phase microscope led the core researchers at the LBRC to design and develop a quantitative phase microscope based on spectral-domain optical coherence tomography and line-field illumination. The line-field approach offered major improvements such as multi-point phase measurement along the line of illumination and high measurement sensitivity of 41pm/ÖHz. More specifically, the setup allows acquiring single-shot B-scan amplitude and phasing images of the sample under study at 1-kHz-frame-rate.
Figure 1. (a) Schematic of line-field phase microscope (LFPM). (b) Typical 2-D recorded interferogram illustrating spectral and spatial measurements along the two orthogonal directions of the 2-D spectrometer. SMF: single mode fiber, i: ith spherical lens, CL: cylindrical lens, BS: beam splitter, S: slit, G: diffraction grating.
Figure 1.12(a) shows the experimental setup of line-field reflection phase microscope that uses a Ti:Sapphire laser as a broadband source. A cylindrical lens (f = 300 mm) is used along with achromatic lenses and a microscope objective to yield line focused illumination beam in the object plane. The 2-D spectrometer consists of a reflection grating (300 lines/mm) and a high-speed CMOS camera (Photron 1024PCI). Figure 1.12(b) shows a typical 2-D interferogram recorded by the line-field phase microscope. For each lateral position, the spectral data is resampled evenly in wavenumber space, numerically compensated for dispersion, and Fourier transformed to get the depth-resolved phase and amplitude information of the sample. With the high phase-detection sensitivity (41 pm/ÖHz) of our line-field reflection phase microscope, we have measured the membrane dynamics and demonstrated 2-D surface profiling of a HeLa cell.
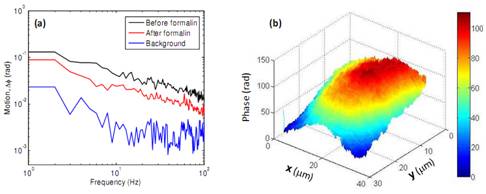
Figure 2. (a) Membrane fluctuations of a HeLa cell before and after chemical fixation. Note the reduced cellular motions after cross-linking of cellular proteins by formalin fixation. Post-formalin residual motions likely represent residual thermal motion of the cell surface. (b) 2-D surface profile of a HeLa cell measured by displacing the cell across the line-illumination. A total phase of more than 100 radians was measured with respect to the glass coverslip. Assuming the average index of the cell as 1.37, the overall cell height was estimated as 5 microns.
- Choma MA, Ellerbee AK, Yang C, Creazzo TL, Izatt JA. Spectral-domain phase microscopy. Optics letters. 30, 1162-4 (2005).
- Joo C, Akkin T, Cense B, Park BH, de Boer JE. Spectral-domain optical coherence phase microscopy for quantitative phase-contrast imaging. Optics Letters. 30, 2131-3 (2005).
- Sarunic MV, Weinberg S, Izatt JA. Full-field swept-source phase microscopy. Optics Letters. 31, 1462-4 (2006).
- Yamauchi T, Iwai H, Miwa M, Yamashita Y. Low-coherent quantitative phase microscope for nanometer-scale measurement of living cells morphology. Optics Express. 16, 12227-38 (2008). PMID: 18679500.
- Yaqoob Z, Choi W, Oh S, Lue N, Park Y, Fang-Yen C, Dasari RR, Badizadegan K, Feld MS. Improved phase sensitivity in spectral domain phase microscopy using line-field illumination and self phase-referencing. Optics Express. 17, 10681-7 (2009). PMCID: PMC2844447.
|
 |