|


|
||||
|
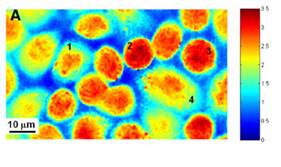
LBRC outside projects Cell growth cycle using dry mass measurements In a steady state cell population, cell growth is coordinated with cell cycle progression, that is, the cellular biomass doubles in quantity during each cell cycle, so that the average cell size is constant over time. Prior research studies on yeast cell growth show that there are internal mechanisms to achieve this [1, 2]. In metazoan cells, there is some evidence that cell growth and cell cycle may be independently regulated [2, 3]. However, both the phenomenon and its biochemical circuit are only poorly understood, and the existing observations of mammalian cell growth deduced contradictory models. For example, it is known that primary rat Schwann cells exhibit a growth rate that is independent of cell size [3], while mouse lymphoblastoid cells grow exponentially with time [4]. This discrepancy may reflect the difference between cell types or the experimental conditions, and for further understanding of metazoan cell growth, it is essential to make more experimental observations of the cell size dynamics. An ideal observation will record the size of individual cells along the cell cycle progression in time-series measurements. The major difficulty with the growth measurement is having sufficient accuracy; at least 6% accuracy is needed in size measurement to clearly distinguish the different growth models [4]. The most accurate results have been reported by Tzur et al. [4] using the diameter of spherical cells, and by Godin et al. [5] using the buoyant mass. However, the cell growth is basically the creation of new biomass, the polymerization of small molecules, so the size measurement that depends on diameter or volume may be more artifact-prone if cell density changes. The buoyant mass measurement by Godin et al. is more appropriate in that respect and quite accurate, but their technique requires the cells to flow back and forth within a micro-cantilever system, whose effect on cell growth is unknown yet. On the other hand, the optical measurement of dry mass is promising because it minimally perturbs the cell, and directly provides the dry mass, which is most closely related to the growth. LBRC has developed a number of quantitative phase microscopy techniques with high spatial and temporal sensitivity to measure the dry mass of live cells. The lab first demonstrated cell growth measurement for extended time periods (~2hr) using the Fourier phase microscopy (FPM) [7]. Figure 1 shows time-lapse measurements of the dry mass of HeLa cells. It can be seen that Cell 4 exhibited linear growth at a rate of 0.34 pg/min, while Cell 1 grew at a rate of 0.07 pg/min. In contrast, Cell 2 showed virtually no change in mass, whereas Cell 3 appeared to exhibit a slight oscillatory behavior, the origin of which is unclear. Such cell-to-cell variation in growth dynamics has been very difficult to study because there is no other technique that can measure the individual cell's mass for live adherent cells. This unique capability of quantitative phase microscopy will open many new possibilities in cell growth research. Recently we have devised Low-coherence Diffraction Phase Microscopy (LCDPM) that supersedes FPM for long-term time lapse studies of cellular dynamics. LCDPM is highly stable over extended period of time up to many days because it has the common-path geometry for interferometry. As a result, LCDPM acquires quantitative phase images with high-transverse resolution and sub-nanometer path-length stability over many hours. A collaborative study is underway with Professor Marc Kirschner, founding chair of the Department of Systems Biology, Harvard Medical School, to answer fundamental questions related to the cell growth cycle.
|
||||

 (3)
(3) 

| [ Home | Overview | Research | People | Facilities | History | Events | Contact | MIT ] | Lab Intranet |