Non-Invasive Measurement of Blood Analytes using Raman spectroscopy
Methods
NIR Raman spectroscopy combines the substantial penetration depth of NIR light with the excellent chemical specificity of Raman spectroscopy. Additionally, it enables simultaneous determination of multiple blood analytes. As part of our current research, we are developing new techniques to reduce prediction errors for our future clinical studies.
Turbidity corrected Raman spectroscopy
Our laboratory has been developing techniques based on simultaneous acquisition of diffuse reflectance and Raman spectra to correct for turbidity-induced distortions in the Raman spectra. Our initial technique, which we call intrinsic Raman spectroscopy, was proposed in this regard. Since then, studies in our laboratory have led to an improved method that does not require prior calibration and is very simple to implement in vivo. This new method, which we call turbidity corrected Raman spectroscopy (TCRS), can compensate for intensity as well as spectral distortions in acquired Raman spectra. TCRS is based on the photon migration picture. The underlying principle of this approach is that when Raman and diffuse reflectance spectra are acquired with the same excitation-collection geometry, the respective photons undergo similar scattering and absorption events in the turbid medium.
We have demonstrated the effectiveness of this method in prospective prediction of glucose via both explicit and implicit multivariate calibration techniques. The above studies were done using unprocessed Raman spectra; the fluorescence backgrounds were not removed. The reduction in prediction error is expected to be even more significant once the fluorescence background of the observed Raman spectra is removed by the novel implementation of shifted excitation Raman difference spectroscopy (SERDS) technique. In conjunction with the application of SERDS, it is expected that TCRS will be able to further improve the prediction accuracy of the calibration strategy.
Fluorescence rejection using shifted excitation Raman difference spectroscopy (SERDS)
The presence of fluorescence (or luminescence) background in the Raman spectrum can compromise the quantitative prediction capabilities of biological Raman spectroscopy. Hence, it is critical to obtain a Raman spectrum free of such background, especially when the latter has substantial contributions from numerous fluorophores. Moreover, photobleaching of these fluorophores can further complicate the situation. For any Raman spectroscopic study conducted over a substantial period of time, the fluorescence background of successive spectra undergo changes in both intensity and shape. Our laboratory, as well as other research groups, has approached this problem by subtracting a best fit polynomial, typically of fifth-order, to the acquired Raman spectrum and thus removing the slowly varying background, assumed to be fluorescence.
We have currently introduced a novel implementation of shifted excitation Raman difference spectroscopy (SERDS) for measurement of blood analyte concentrations using Raman spectroscopy. This technique, originally introduced by Shreve et. al. [1992], is based on the principle that when Raman spectra are excited by two laser lines closely spaced in frequency, the Raman peaks shift with the laser frequencies whereas the broad fluorescence background remains unchanged. Subtracting the two spectra can thus remove the fluorescence and provide Raman spectra free of fluorescence, which are devoid of spectral artifacts.
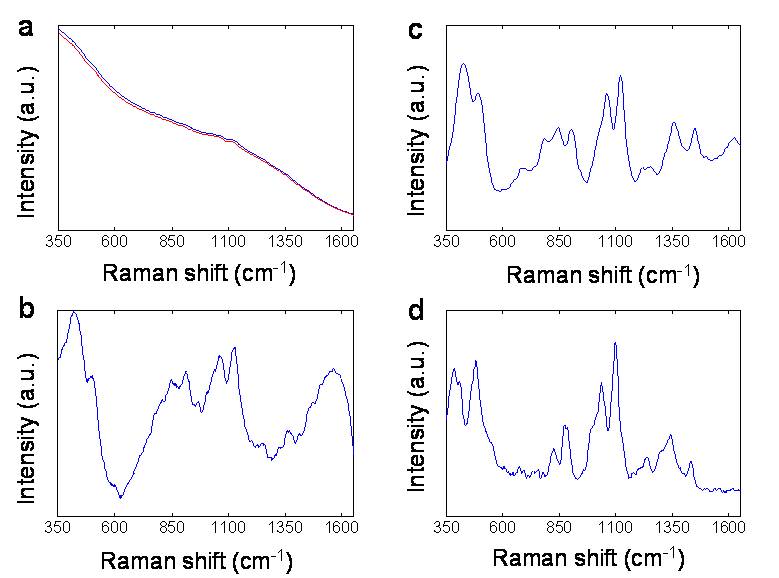
To implement the SERDS technique an Argon ion (Newport) pumped tunable cw Ti-sapphire laser (Spectra Physics) is used for Raman excitation. An in vitro study was carried out to compare the relative performance of SERDS and polynomial subtraction techniques in extracting Raman signals. The shifted spectra were acquired by applying an 8 cm-1 excitation wavenumber shift (~0.6 nm shift for a base wavelength of 830 nm). The underlying fluorescence background masks almost all of the Raman features (Fig. 3a). The acquired Raman spectra from the physical tissue model were then subjected to both SERDS analysis and best fit polynomial subtraction. Fig. 3b shows the spectrum obtained after subtracting the best fit 5th order polynomial. The SERDS reconstructed Raman spectrum is shown in Fig. 3c. When the spectra in Figs. 3b and 3c are compared with the pure glucose spectrum of Fig. 3d, a significantly better correspondence can be seen between the SERDS reconstructed spectrum and the pure glucose spectrum (r2 = 0.75) than between the 5th order polynomial subtracted spectrum and the pure glucose spectrum (r2 = 0.4).
In addition, an in vivo study was conducted to demonstrate the feasibility and effectiveness of SERDS under in vivo conditions, as well as to characterize its ability to account for photobleaching in fluorescing samples.
|
Figure 3. (a) Shifted Raman spectra obtained with two different excitation frequencies (b) 5th order polynomial subtracted Raman spectrum (c) SERDS – reconstructed Raman spectrum (d) pure glucose spectrum. |
We expect that the application of SERDS will significantly improve the quantitative prediction capability of our approach. Additionally, it can substantially improve the performance of the constrained regularization (CR) multivariate analysis technique developed in our laboratory [Shih 2007]. While CR outperforms PLS particularly for samples where the analyte of interest has a strong degree of correlation with an interferent, its performance is impaired by the presence of a large fluorescence background. The application of SERDS can therefore enhance the performance of CR over other multivariate calibration techniques.
|
 |