Optical Detection of Sub-nanometer Motions in Biological Cells
Background
Physical or mechanical response of biological cells to an external stimulus (whether chemical, mechanical or electrical) is getting more attention with the advance of techniques that allow researchers to probe minuscule forces / motions. The most common techniques to measure the mechanical response of cells include atomic force microscopy, magnetic twisting cytometry, micropipette aspiration, and shear flow methods. These methods rely on mechanical interaction between the cell and the probe. In contrast, interferometric optical techniques are attractive because they (a) are non-invasive, (b) can measure changes in cell shape with nanometer sensitivity in the axial direction, and (c) can be used in wide-field approach to discern spatially resolved information. For the past several years, Spectroscopy Laboratory has developed optical interferometric systems capable of detecting nanometer scale motions of biological cells. Specifically, these systems have been deployed to conduct following studies:
1. Measurement of Nerve Displacement during Action Potential with a Dual-Beam Low-Coherence Interferometer
Nerve fibers exhibit rapid outward lateral surface displacements during the action potential. This swelling phenomenon, which is generally attributed to water influx into axons, has been observed in a number of invertebrate and vertebrate preparations. Measurement of nerve displacements requires a system that is capable of measuring nanometer-scale displacements in surfaces of low reflectivity at ~1-kHz bandwidth. Observations of nerve swelling have so far employed sensors placed in physical contact with the nerve, which may introduce artifacts. Laser Doppler vibrometry, speckle vibrometry, and laser feedback interferometry are sensitive to small displacements but are susceptible to external perturbations and may be difficult to apply to weakly reflecting objects.
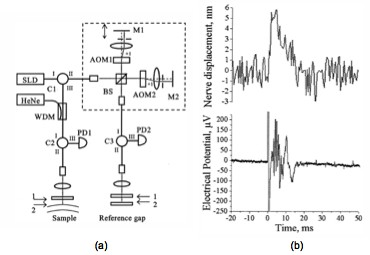
We have developed a dual-beam heterodyne low-coherence interferometer to optically measure the swelling effect in a lobster nerve bundle [see Figure 1 (a)]. The interferometer design described here is based on phase-referenced interferometry, in which phase noise is canceled by measurement of motions relative to a nearby surface. An unequal-arm Michelson interferometer compensates for the path delay between sample and reference ref lections, and a differential measurement scheme that uses a passive reference gap compensates for phase noise in the Michelson interferometer. The use of low-coherence (broadband) light permits depth-selective measurement of weak ref lections, as in optical coherence tomography. A test measurement at 1-kHz bandwidth gave a rms phase noise of 0.069 mrad, corresponding to a rms displacement of 8.5 pm. Figure 1 (b) shows the electrical potential and optically measured displacement of a nerve for one trial. The spike at time zero in the electrical signal is due to a stimulus artifact. It is followed by a series of peaks that correspond to action potentials of axons in the nerve bundle. The optical signal shows a peak height of 5 nm and a FWHM duration of 10 ms, with a direction corresponding to an upward displacement. The noise of the displacement measurement was 0.25 nm for 1-kHz bandwidth.
|
| Figure 1.(a) Interferometer design. Dashed box, Michelson interferometer. SLD, superluminescent diode; AOM1, AOM2, acousto-optic modulators; M1, M2, mirrors; C1–C3, optical circulators; BS, beam splitter; PD1, PD2, InGaAs photo-detectors; HeNe, guide laser; WDM, wavelength division multiplexer; 1’s and 2’s, surfaces of the sample and of the reference gap. (b) Nerve displacement and electrical potential. Single-shot measurements (no signal averaging). Stimulus current for this trial, 4 mA. Displacement signal low-pass filtered at 1 kHz. Positive displacements correspond to an increase in the height of the nerve surface. The optical signal shows a peak height of 5 nm and a FWHM duration of 10 ms, with a direction corresponding to an upward displacement. |
2. Imaging Voltage-dependent Cell Motions with Heterodyne Mach–Zehnder Phase Microscopy
It has been reported that action potentials can be measured by light scattering in case of invertebrate neurons (Stepnoski et. al. PNAS 1991). Vertebrate neurons are significantly smaller than invertebrate neurons. Therefore the amount of scattered light is very small, making the scattering experiment difficult. Quantitative phase microscope is unaffected by this constraint since it measures phase delay of light transmitted through the sample. Furthermore it provides spatial information of the motion signal. For this purpose, we have developed a heterodyne Mach–Zehnder phase microscope that can image the voltage-induced motion of cells.
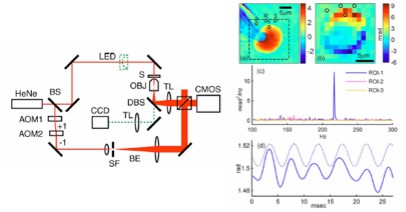
The setup [Fig. 2 (left)] consists of a Mach–Zehnder laser interferometer integrated with an inverted microscope. A helium–neon laser (Melles Griot) is collimated and divided into sample and reference paths by a beam splitter. The sample beam passes through the cell whereas the reference beam is frequency shifted by two acousto-optic modulators (AOMs). The two beams are combined by a beam splitter before arriving at the CMOS for interference. The frequency difference between the sample and the reference beams is set to be four times the frame rate of the camera. Four consecutive frames are acquired and processed using standard phase shifting interferometry technique to obtain one quantitative phase image.
As part of our investigation of voltage-dependent cell motions, we measured the voltage-induced motion of cells expressing prestin. Prestin, the motor protein of the cochlear outer hair cells, directly transduces changes in the transmembrane voltage to membrane motions. Figure 2 (a) shows a phase image of a cell in a microchamber electrically stimulated at 217 Hz frequency and 400 mV (peak-to-peak) amplitude. Heterodyne Mach-Zehnder phase microscope successfully imaged voltage induced motion of ~10nm size.
|
| Figure 2. (Left) Heterodyne Mach–Zehnder phase microscope. HeNe, helium–neon laser; solid line, laser beam; dashed line, bright-field illumination beam. In the sample path: S, sample; OBJ, objective lens f=f1[1]; DBS, dichroic beam splitter; TL, tube lenses f=f2[1]; LED, light emitting diode bright-field illuminator (removed during interferometry measurements); CCD, camera for bright-field and fluorescence imaging. In the reference path: AOM1,2, acousto-optic modulators; BE, beam expander; SF, spatial filter; CMOS, camera for interferometric imaging. Not shown: mercury lamp fluorescence illuminator and filter cube in the bright-field illumination path. Figure 2. (Right) (a) Phase image of prestin transfected HEK 293 cell in a micropipette. Squares, regions of interest (ROI) labeled 1–3 and reference region R. Phase in radians. (b) Map of the in-phase component of fast Fourier transform at stimulus frequency. ROIs are denoted by circles. (c). Power spectra of the phase signals from ROIs 1–3. (d) Solid line, time trace of phase of ROI-1 referenced by ROI-R; dashed line, 217 Hz, 20 mrad peak-to-peak amplitude sine wave. |
Future Directions
We are currently working on the improvement of both reflection and transmission systems for the optical imaging of the action potential induced motion of mammalian neurons. The optical systems must have extremely low phase noise for sub-nanometer sensitivity. To achieve this goal, we are employing low-coherence interferometry and common-path configurations.
References
-
C. Fang-Yen, M. C. Chu, H. S. Seung, R. R. Dasari, and M. S. Feld, “Noncontact measurement of nerve displacement during action potential with a dual-beam low-coherence interferometer,” Optics Letters, Vol. 29, Issue 17, pp. 2028-2030, 2004.
-
C. Fang-Yen, S. Oh, Y. Park, W. Choi, S. Song, H. S. Seung, R. R. Dasari, and M. S. Feld, “Imaging voltage-dependent cell motions with heterodyne Mach–Zehnder phase microscopy,” Optics Letters, Vol. 32, No. 11, pp. 1572 June 1, 2007.
|
 |